Introduction
Spatially Fractionated Radiotherapy (SFRT) is an advanced technique that delivers high radiation doses, typically 15–20 Gy, to alternating regions of high and low doses within the Gross Tumor Volume (GTV) [ 1 - 4 ]. This approach is particularly beneficial for large, unresectable, and radio-resistant tumors, which present significant challenges when treated with conventional radiotherapy due to toxicity and dose-response limitations [ 5 - 7 ]. SFRT provides a high therapeutic ratio with minimal adverse effects in treating such tumors [ 5 , 8 - 10 ].
In conventional SFRT, grid blocks or Multi-leaf Collimator (MLC) systems are commonly used to generate a grid pattern. Although these methods have shown effectiveness in many cases, two-dimensional (2D) fields face limitations when treating deep tumors within the body. Since they rely on a single treatment field, the desired dose may not adequately reach the tumor, and certain normal tissues may receive excessive radiation exposure [ 5 , 11 , 12 ].
Grid fields based on Volumetric-Modulated Arc Therapy (VMAT) technology can be highly effective in such conditions. In this technique, beam modulation and changes in gantry position help protect Organs at Risk (OAR) while delivering high doses of radiation to small target areas [ 3 , 7 , 11 ]. Additionally, compared to conventional SFRT, this method offers several advantages, including improved precision in controlling the maximum dose location, greater efficiency in treating deep-seated tumors, customizable patient-specific designs, and better sparing of superficial tissues [ 5 ].
VMAT-based SFRT can be performed in either virtual 2D or 3D lattice configurations. Virtual 2D VMAT-based SFRT involves defining cylindrical targets within the GTV volume to deliver a high dose of radiation. Unlike traditional grid therapy, which uses lead blocks to create a heterogeneous field, this method utilizes VMAT without requiring external devices. On the other hand, 3D Lattice radiotherapy, derived from 2D GRID therapy, integrates modern advancements in radiation delivery methods, including Intensity Modulated Radiation Therapy (IMRT), VMAT, and robot-assisted converging beams. This approach generates multiple localized high-dose regions (spherical targets) within the GTV [ 5 ]. Previous studies have explored the feasibility of performing SFRT using VMAT in both 2D and 3D configurations [ 9 , 10 , 12 ]. However, it remains unclear, which of these approaches is superior, and the effects of target geometry (2D versus 3D) and dose prescription on dosimetric and therapeutic parameters have not been fully investigated. Furthermore, this is the first study to calculate Normal Tissue Complication Probability (NTCP) values for virtual grid therapy based on VMAT. This study compares two VMAT-based approaches for treating large lung tumors, focusing on how grid target geometry and dose prescription affect key metrics, including the GTV mean dose, Equivalent Uniform Dose (EUD), Valley-to-Peak Dose Ratio (VPDR), Therapeutic Ratio (TR), and NTCP. By addressing gaps in the current understanding of the relative effectiveness of 2D versus 3D SFRT and their impact on treatment parameters, this study aimed to provide valuable insights for optimizing SFRT strategies.
Material and Methods
Contouring and grid design
In this experimental study, five lung cancer patients with tumor volumes ranging from 167.255 cm³ to 877.485 cm³ (diameters greater than six centimeters) were retrospectively selected from the Cancer Institute of Imam Khomeini Hospital, Tehran, Iran. A physician imported Computed Tomography (CT) images of the patients into the Varian Eclipse treatment planning system (version 13.6) for contouring.
The virtual grid pattern consisted of three main structures: the GTV, the grid target, and the avoidance volume. The grid target represented unshielded areas corresponding to the openings in commercial grid blocks, while the avoidance volume represented shielded areas. These structures create a peak-and-valley dose distribution, achieving a high dose gradient within the GTV. The treatment plan was optimized by targeting high-dose regions within the GTV and minimizing doses to organs at risk [ 13 ].
In VMAT-based grid therapy, grid targets are often designed with cylindrical or spherical geometries [ 7 , 11 , 14 ]. Based on this, we developed two virtual grid therapy patterns. The first, the ‘2D VMAT-based SFRT’ (2D-SFRT) plan, utilized parallel cylindrical targets within the GTV, while the second, the ‘3D-Lattice Radiotherapy’ (3D-LRT) plan, employed spherical targets. Both plans designated the areas between the targets as avoidance volumes. A shell structure was defined around each target to enhance dose conformity and control the dose gradient within the GTV. Grid targets were positioned exclusively within the GTV, with their centers spaced 2.5 to 3 cm apart in all directions. Each target’s edge was kept at least 1 cm away from any Organ at Risk (OAR) by adding a 1 cm internal margin within the GTV. Depending on the geometry, size, and position of the GTV, 1 to 5 cylindrical targets and 3 to 15 spherical targets were placed within this internal margin (Figure 1).
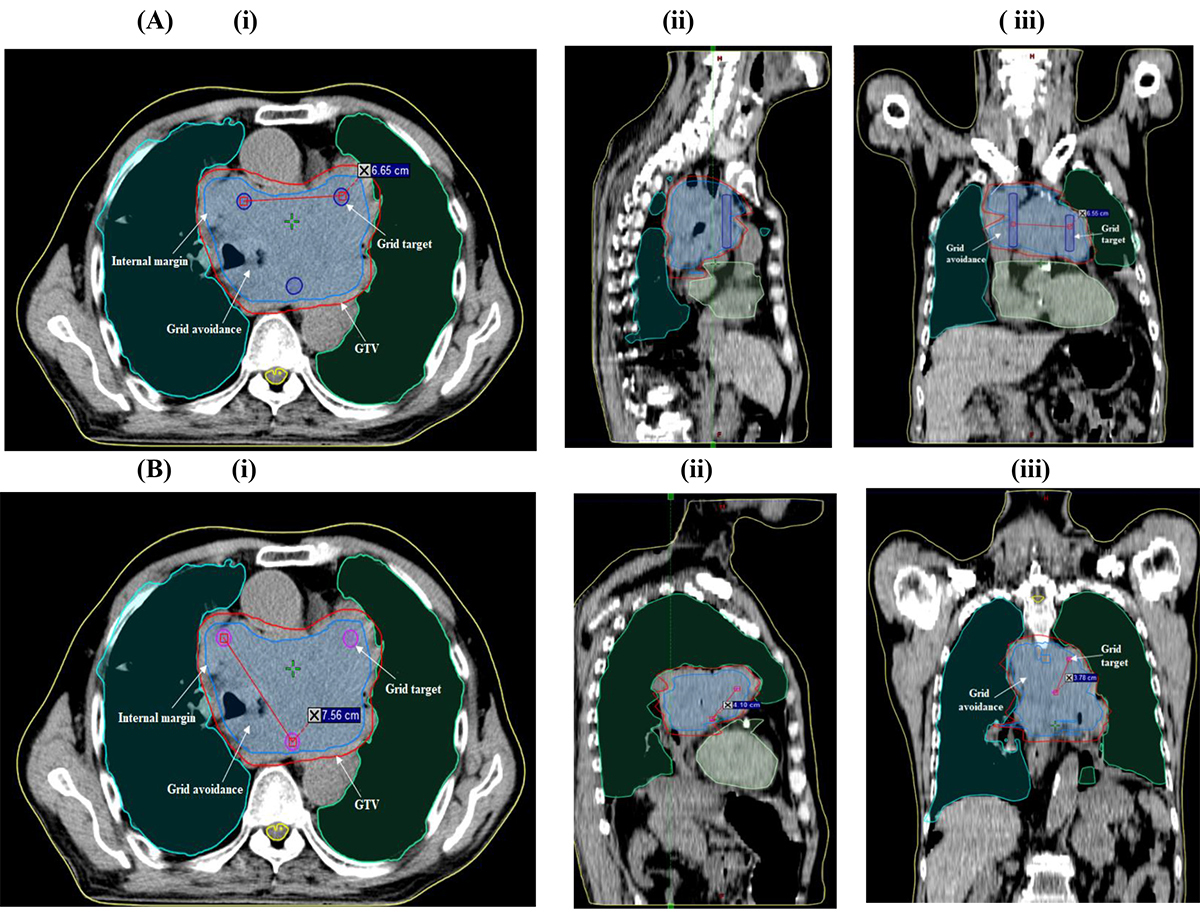
Figure 1. Position of the cylindrical (A) and spherical grid targets (B) within the gross tumor volume (red) and internal margin (blue) in (i) axial, (ii) sagittal, and (iii) coronal views.
The diameter of the cylinders and spheres was set to 1 cm, with a center-to-center distance of at least 3 cm in the sagittal and coronal planes and at least 6 cm in the axial plane. The choice of 1 cm is based on the observation that most physical grid blocks have holes approximately 1 cm in diameter at the isocenter. However, an ideal diameter or spacing has not yet been established for grid blocks [ 11 ]. The arrangement of grid targets is illustrated in both two-dimensional (2D) and three-dimensional (3D) views (Figure 2).
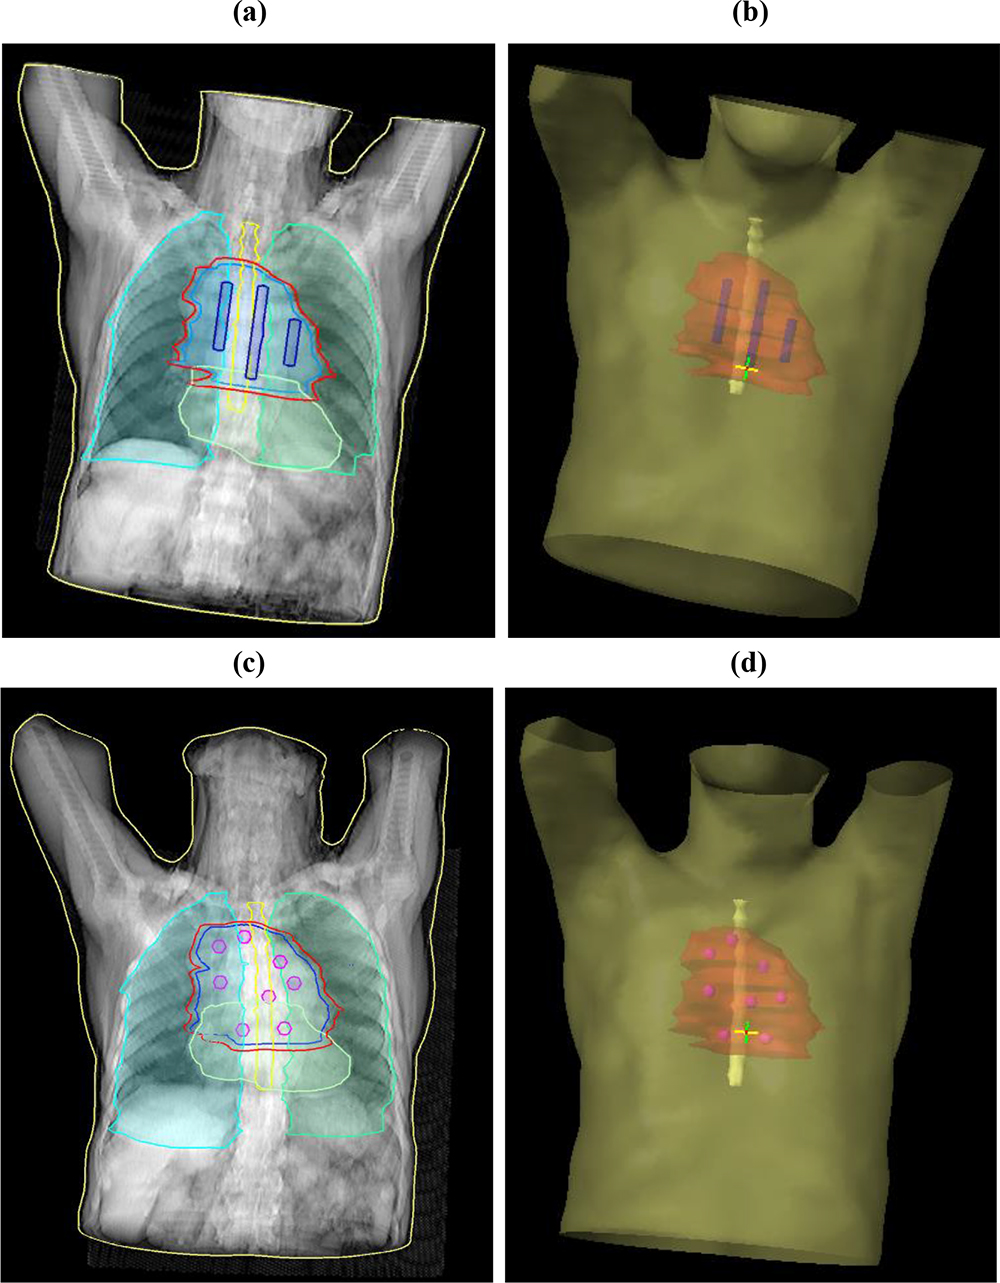
Figure 2. Arrangement of cylindrical (a,b) and spherical (c,d) grid targets within the tumor volume located in the patient’s lungs.
Treatment planning
After contouring, the CT images and contours were transferred to the Elekta Monaco TPS (version 5.10.02). Treatment plans were designed using 15 Gy and 20 Gy doses from 6 MV Flattening-filter-free (FFF) photon beams for single-fraction delivery to the isocenter of the grid targets. The plan aimed to deliver the highest possible dose (120% to 150% of the prescribed dose) to the grid targets while minimizing the dose to the OARs and avoidance volumes (keeping it below 5 Gy). A series of constraints were then established for the dose in the grid target volumes, avoidance volumes, and the outer shell surrounding the grid targets to achieve maximum dose heterogeneity. Depending on the size of the GTV and the number of grid targets, two to four full 360-degree arcs and partial arcs were utilized.
Plan Evaluation
Due to the dose heterogeneity in grid therapy, conventional dose coverage evaluations, such as the dose to 95% of the volume (D95), are not suitable for grid therapy treatment plans. In this study, to assess GTV dose coverage, both the mean dose and the EUD for the GTV were calculated. Additionally, the dose distributions of the GTV were converted to EUD to compare treatment plans. The EUD represents the dose that, if uniformly delivered to the tumor volume, would result in the same average survival fraction as non-uniform irradiation. It is calculated using the following equation (1) [ 13 ]:
where Vi is the percentage of the volume receiving the dose Di and α = 0.542 (Gy−1) and β = 0.0193 (Gy−2) are cell-specific parameters of the LQ model for the lung cancer cell line (H460) [ 15 ].
One of the key dosimetric parameters in SFRT is the VPDR, which indicates the heterogeneity of dose distribution. It is defined as the ratio of the minimum dose to the maximum dose (Dmin/Dmax) within the GTV. The VPDR is typically defined as the ratio of the average dose delivered to the 5% of the internal margin receiving the lowest doses to the maximum dose of the grid targets. In this study, dose distribution heterogeneity was assessed using both the VPDR and dose profiles. Dmax refers to the maximum dose delivered to 0.5 cc of the GTV, while Dmin represents the minimum dose covering 100% of the GTV volume (D100) [ 7 ].
NTCP Calculation
The NTCP is a dose-dependent mathematical model to assess the probability of side effects in normal tissues due to radiation exposure. It serves as a tool for differentiating between treatment plans. In this study, the Lyman–Kutcher–Burman (LKB) model was used to calculate NTCP for the three-dimensional normal organs surrounding the lung tumor, including the spinal cord, heart, and normal lung tissue (Equations 2-5).
D represents the dose, V denotes the fraction of the irradiated organ volume, TD indicates the organ’s tolerance dose (tolerance limit), and TD50 signifies the total organ dose, leading to a 50% probability of complication. Vref refers to the reference volume for TD50. The parameter n influences the relationship between complication probability and volume, while the parameter m determines the gradient of the complication probability versus dose curve. The LKB model, as outlined in equations (2) to (5), assumes that a portion of the organ receives uniform irradiation, while the rest remains completely unirradiated. This assumption does not fully reflect clinical exposure scenarios [ 15 ]. To address this discrepancy, the model can be adjusted to accommodate varying dose fields using a method originally proposed by Kutcher et al., [ 16 ]. The equations required for this transformation are as follows:
In this context, the index i signifies a specific voxel within the target volume, Di represents the dose delivered to voxel i, and Vi indicates the volume contribution of that voxel. The term (δVeff)i represents the modified effective volume calculated by assuming that the volume Vi, originally exposed to dose Di, is instead subjected to the maximum dose Dm received by any voxel in the organ. Using the histogram reduction method, a variable dose distribution is converted into an equivalent one where part of the effective organ volume Veff uniformly receives Dm, while the rest remains unexposed, as outlined in equations (6) and (7). This processed information can then be applied in the LKB model to determine the NTCP for the organ. The inputs required to calculate NTCP consist of a Dose-volume Histogram (DVH) and the parameters n, m, and TD50 for the organ, as provided by Burman et al., [ 17 ].
Calculation of Therapeutic Ratio (TR)
In this study, the method proposed by Ziker [ 18 ] was used to calculate the therapeutic ratio. The survival fraction of normal cells was determined twice: once for the grid field (Equation 8) and once using the EUD for the homogeneous field (Equation 9), both calculated using the linear-quadratic (LQ) model.
Here, α = 0.633 Gy−1 and β = 0.0120 Gy−2 parameters of AGO-1522 human fibroblast cells are used as representatives of normal tissue [ 15 ].
The therapeutic ratio is calculated as the ratio of the survival fraction of normal cells in the grid field to the survival fraction of the same cells in a homogeneous field (Equation 10):
Results
The dose distribution between 2D-SFRT with cylindrical grid targets and 3D-LRT with spherical grid targets is compared in the coronal, axial, and sagittal planes (Figure 3). In the coronal and sagittal views, the 3D-LRT plan demonstrates spatial dose modulation along the superior-inferior direction, resulting in significantly lower doses between the spheres in this direction relative to the 2D plan.
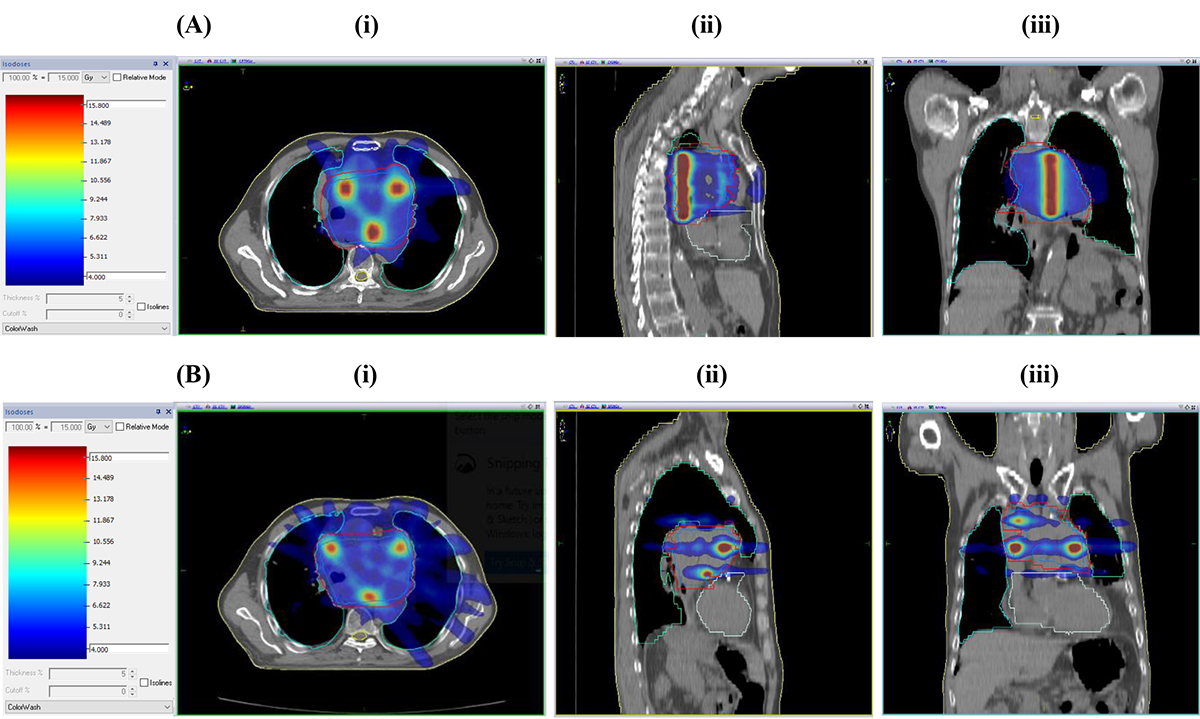
Figure 3. The dose distribution map of (A) cylindrical and (B) spherical grid targets in (i) axial, (ii) sagittal, and (iii) coronal views, respectively.
The mean dose, EUD, and VPDR in the GTV for 15 and 20 Gy doses are summarized (Table 1). For a 15 Gy dose, the median GTV mean dose was 8.36 Gy (range: 8.09–8.66 Gy) and the median GTV EUD was 5.90 Gy (range: 4.87–6.76 Gy) in 2D-SFRT plans. The 3D-LRT plans delivered a median GTV mean dose of 7.98 Gy (range: 7.84–8.28 Gy) and a median GTV EUD of 4.67 Gy (range: 4.42–5.50 Gy). The median VPDR for 2D-SFRT plans was 0.32 (range: 0.28–0.37), while for 3D-LRT plans, it was 0.29 (range: 0.23–0.32). For a 20 Gy dose, the median GTV mean dose in 2D-SFRT plans was 8.56 Gy (range: 8.18–9.17 Gy), with a median GTV EUD of 6.90 Gy (range: 5.94–8.82 Gy). In comparison, for 3D-LRT plans with the same 20 Gy dose, the median GTV mean dose was 8.11 Gy (range: 7.99–8.19 Gy), and the median GTV EUD was 5.89 Gy (range: 4.87–6.04 Gy). Additionally, the median VPDR for 2D-SFRT plans was 0.26 (range: 0.24–0.36) compared to 0.19 (range: 0.18–0.29) for 3D-LRT plans. These data indicate that 2D-SFRT plans generally deliver a higher average dose to the GTV with greater variability in dose distribution compared to 3D-LRT plans.
| Patient | Dose (15 Gy) | Dose (20 Gy) | ||||||||||
|---|---|---|---|---|---|---|---|---|---|---|---|---|
| 2D-Spatially Fractionated Radiotherapy | 3D- Lattice Radiotherapy | 2D-Spatially Fractionated Radiotherapy | 3D- Lattice Radiotherapy | |||||||||
| Dmean (Gy) | Equivalent Uniform Dose (Gy) | Valley-to-peak Dose Ratio | Dmean (Gy) | Equivalent Uniform Dose (Gy) | Valley-to-peak Dose Ratio | Dmean (Gy) | Equivalent Uniform Dose (Gy) | Valley-to-peak Dose Ratio | Dmean (Gy) | Equivalent Uniform Dose (Gy) | Valley-to-peak Dose Ratio | |
| 1 | 8.66 | 6.39 | 0.34 | 8.00 | 4.67 | 0.26 | 8.95 | 8.39 | 0.31 | 7.99 | 4.87 | 0.18 |
| 2 | 8.56 | 6.76 | 0.37 | 7.98 | 4.95 | 0.32 | 8.56 | 6.90 | 0.25 | 8.16 | 6.04 | 0.28 |
| 3 | 8.36 | 5.90 | 0.32 | 7.84 | 4.72 | 0.29 | 9.17 | 8.82 | 0.36 | 8.07 | 5.91 | 0.29 |
| 4 | 8.09 | 5.31 | 0.29 | 7.84 | 4.42 | 0.23 | 8.18 | 5.94 | 0.24 | 8.19 | 5.89 | 0.19 |
| 5 | 8.15 | 4.87 | 0.28 | 8.28 | 5.50 | 0.29 | 8.52 | 6.11 | 0.26 | 8.11 | 5.44 | 0.18 |
The Therapeutic Ratio (TR) values for 2D-SFRT and 3D-LRT plans with prescribed doses of 15 Gy and 20 Gy are presented (Table 2). For 2D-SFRT plans, the median TR was 7.61 (range: 7.21–10.27) at 15 Gy and 8.00 (range: 7.42–10.62) at 20 Gy. In comparison, for 3D-LRT plans, the median TR was 10.21 (range: 7.81–11.20) at 15 Gy and 10.32 (range: 7.99–11.71) at 20 Gy.
| Patient | 2D-Spatially Fractionated Radiotherapy | 3D-Lattice Radiotherapy | ||
|---|---|---|---|---|
| Dose (15 Gy) | Dose (20 Gy) | Dose (15 Gy) | Dose (20 Gy) | |
| 1 | 7.30 | 8.95 | 8.00 | 7.99 |
| 2 | 7.80 | 8.00 | 10.90 | 11.60 |
| 3 | 7.61 | 7.91 | 11.20 | 11.71 |
| 4 | 10.27 | 10.62 | 10.21 | 10.32 |
| 5 | 7.21 | 7.42 | 7.81 | 8.86 |
The NTCP values for the right lung, heart, left lung, and spinal cord for 15 Gy and 20 Gy doses are provided (Tables 3 and 4, respectively). The results indicate that the probability of complications in normal tissues surrounding the lung tumor is negligible for both SFRT plans.
| Patient | 2D-Spatially Fractionated Radiotherapy | 3D-Lattice Radiotherapy | ||||||
|---|---|---|---|---|---|---|---|---|
| Right lung | Heart | Left lung | Spinal cord | Right lung | Heart | Left lung | Spinal cord | |
| 1 | 5.55×10⁻¹⁷ | 3.58×10⁻⁵ | 5.42×10⁻⁵ | 4.77×10⁻⁷ | 5.55×10⁻¹⁷ | 5.80×10⁻⁵ | 4.38×10⁻⁵ | 7.75×10⁻⁶ |
| 2 | 0 | 2.16×10⁻⁵ | 3.03×10⁻⁵ | 1.45×10⁻⁷ | 0 | 2.13×10⁻⁵ | 2.84×10⁻⁵ | 1.74×10⁻⁷ |
| 3 | 3.53×10⁻⁵ | 2.97×10⁻⁵ | 0 | 2.89×10⁻⁷ | 3.34×10⁻⁵ | 2.26×10⁻⁵ | 0 | 8.56×10⁻⁷ |
| 4 | 0 | 2.15×10⁻⁵ | 3.40×10⁻⁵ | 2.59×10⁻⁷ | 0 | 2.14×10⁻⁵ | 3.19×10⁻⁵ | 3.26×10⁻⁷ |
| 5 | 3.39×10⁻⁵ | 3.03×10⁻⁵ | 0 | 1.49×10⁻⁷ | 3.65×10⁻⁵ | 4.55×10⁻⁵ | 0 | 1.42×10⁻⁷ |
| Patient | 2D-Spatially Fractionated Radiotherapy | 3D-Lattice Radiotherapy | ||||||
|---|---|---|---|---|---|---|---|---|
| Right lung | Heart | Left lung | Spinal cord | Right lung | Heart | Left lung | Spinal cord | |
| 1 | 1.01×10⁻¹⁶ | 3.86×10⁻⁵ | 5.98×10⁻⁵ | 1.11×10⁻⁶ | 1.11×10⁻¹⁶ | 4.41×10⁻⁵ | 7.68×10⁻⁵ | 2.56×10⁻⁵ |
| 2 | 0 | 2.15×10⁻⁵ | 2.95×10⁻⁵ | 1.58×10⁻⁷ | 0 | 2.14×10⁻⁵ | 3.20×10⁻⁵ | 1.96×10⁻⁷ |
| 3 | 5.5×10⁻⁵ | 3.74×10⁻⁵ | 0 | 7.50×10⁻⁷ | 4.05×10⁻⁵ | 2.35×10⁻⁵ | 0 | 2.65×10⁻⁶ |
| 4 | 0 | 2.15×10⁻⁵ | 3.84×10⁻⁵ | 3.71×10⁻⁷ | 5.55×10⁻¹⁷ | 2.16×10⁻⁵ | 4.85×10⁻⁵ | 5.31×10⁻⁷ |
| 5 | 3.91×10⁻⁵ | 3.84×10⁻⁵ | 0 | 1.57×10⁻⁷ | 3.64×10⁻⁵ | 4.08×10⁻⁵ | 0 | 1.92×10⁻⁷ |
The dose profiles between two adjacent high-dose areas within the GTV are illustrated (Figure 4). Panel (A) presents the dose distribution for the 3D-LRT plan, highlighting the spatial arrangement of the high-dose regions within the GTV in a coronal view. Panel (B) shows the dose distribution for the 2D-SFRT plan, depicting the neighboring high-dose areas within the same volume. These profiles provide insight into the dose delivery characteristics and spatial distribution. Both 2D-SFRT and 3D-LRT plans exhibit distinct peak-and-valley patterns, aligning with the objective of SFRT. Unlike static-field SFRT, the dose islands are also confined within the tumor volume, with a noticeable dose fall-off between grid targets.
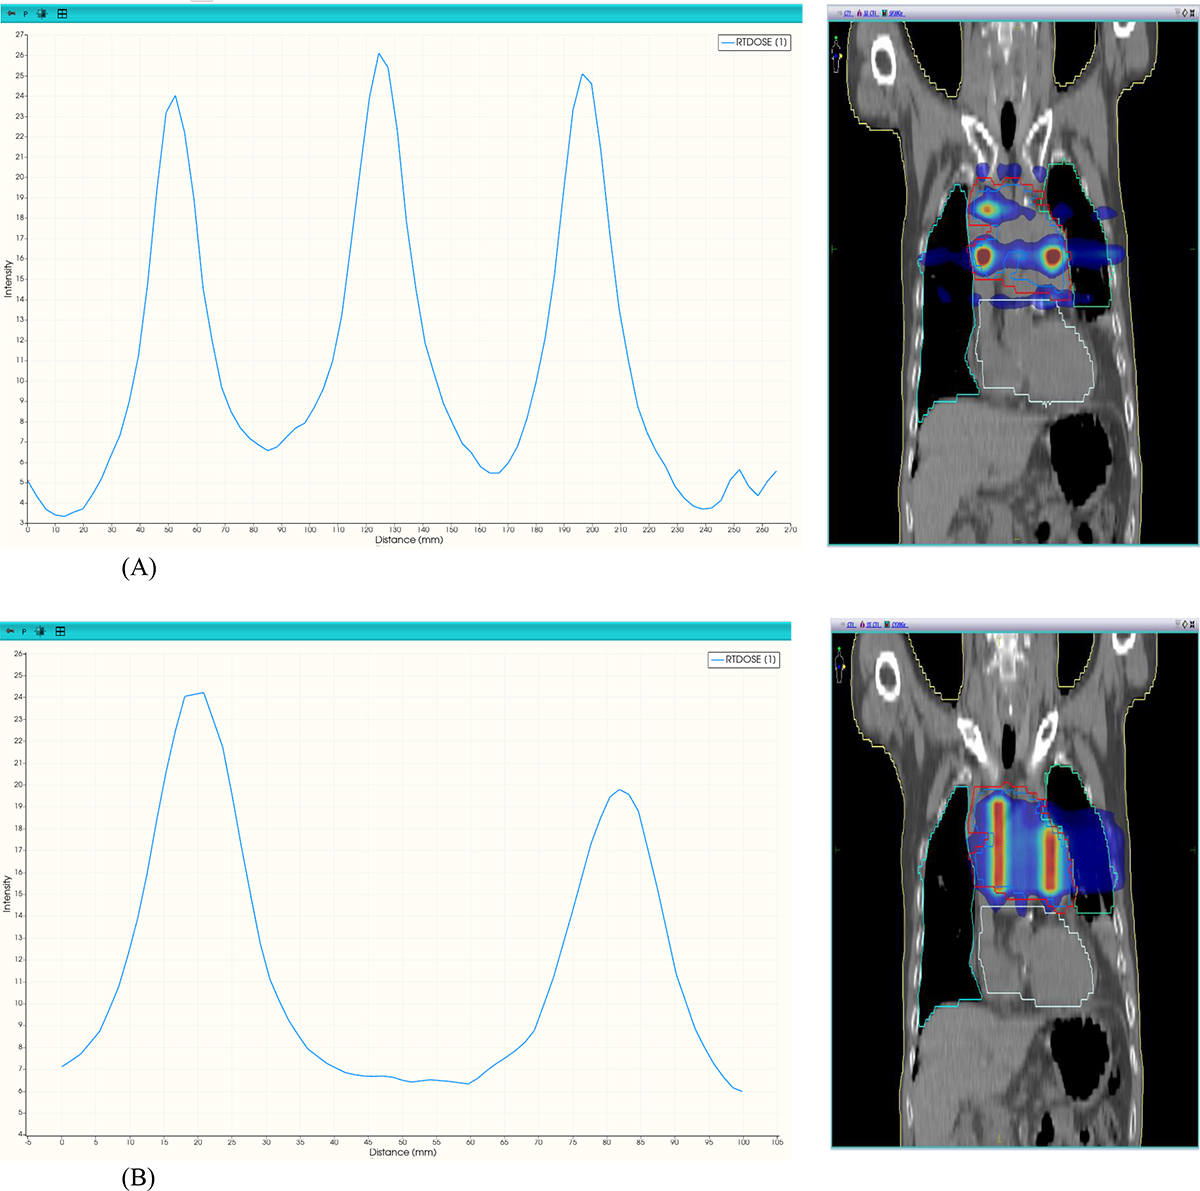
Figure 4. Dose profiles between two adjacent high-dose areas within the Gross Tumor Volume (GTV), in coronal view for the 3D-Lattice Radiotherapy plan (A) and 2D-Spatially Fractionated Radiotherapy plan (B).
Discussion
The VMAT technology can be employed to design grid therapy plans [ 11 , 19 ]. To date, the feasibility of SFRT using both 2D-SFRT has been investigated with cylindrical grid targets and 3D-LRT with spherical grid targets [ 7 - 14 ]. However, the impact of target geometry and prescribed dose on dosimetric parameters and treatment outcomes has not been thoroughly examined. The results of this study reveal significant differences in dose distribution and treatment efficacy between the 2D-SFRT and 3D-LRT techniques.
Due to the inherent dose heterogeneity in SFRT, conventional dose coverage metrics, such as D95, are not suitable for assessing SFRT plans. In this study, the mean dose and EUD of the GTV were calculated to assess its coverage. The results show that the mean dose of the GTV and GTV EUD are higher for the 2D-SFRT plan compared to the 3D-LRT plan. The 2D-SFRT plan, with cylindrical targets, shows spatial dose variations only in the x-y plane. In contrast, the 3D-LRT plan modulates the dose not only in the x-y plane but also along the superior-inferior direction. Additionally, a significant portion of the space between the spheres is classified as an avoidance volume, reducing dose delivery to these regions. This leads to a lower mean dose and EUD compared to the 2D-SFRT plan. These findings are consistent with the values reported in previous VMAT-SFRT studies [ 7 , 11 , 14 ].
The primary characteristic of SFRT is its highly non-uniform dose distribution, with the VPDR being a key dosimetric parameter that reflects this variation. A lower VPDR, indicating a higher degree of dose heterogeneity and a steeper dose gradient, is generally favorable for maximizing the therapeutic ratio in SFRT. However, the relationship between VPDR and treatment outcomes, especially in clinical practice, remains largely unexplored. Theoretically, a lower VPDR could be crucial in SFRT for triggering radiation-induced antitumor immune responses. Steep dose gradients are essential for protecting normal cells, enhancing radiation tolerance, and reducing toxicity [ 20 ]. A higher maximum dose can increase the biological impact on tumors and potentially boost immune responses [ 21 - 24 ]. Furthermore, steep dose gradients can activate radiation-induced bystander effects, which are significant for the effectiveness of grid therapy [ 25 - 27 ]. Previous studies have indicated valley-to-peak ratios between 0.0008 and 2.5 [ 14 , 19 , 28 , 29 ]. The 3D-LRT plan exhibited a lower VPDR compared to the 2D-SFRT plan (Table 1). For the prescribed dose of 15 Gy, the VPDR difference between the two plans ranged from 0.01 to 0.08, with a median value of 0.05. For the prescribed dose of 20 Gy, the difference was greater, ranging from 0.03 to 0.13, with a median value of 0.07.
The optimal pattern of dose heterogeneity and the ideal distribution of valley-peak doses within the tumor that may produce the best tumor response have not yet been established through experimental or clinical studies. These aspects require thorough investigation and clinical implementation. Therefore, the assessment of the therapeutic ratio is essential in evaluating the effectiveness of grid therapy, as it integrates the dosimetric parameters with clinical outcomes.
According to Equation 11, a therapeutic ratio greater than one indicates that normal cells have a higher survival rate in the heterogeneous field than in the uniform irradiation field, while tumor cells experience the same level of damage in both conditions. Therefore, a higher therapeutic ratio signifies better protection of normal cells in the SFRT irradiation fields compared to uniform irradiation fields [ 30 ]. The therapeutic ratio values for both plans exceed one (Table 2). However, the 3D-LRT plan demonstrates a higher TR than the 2D-SFRT plan. Depending on the tumor shape, volume, location, and grid target geometry, the maximum difference in TR can reach up to 4 between the two plans.
In grid treatment using a single static field, such as those delivered with grid collimators or MLC, the grid heterogeneity patterns are largely fixed. This is especially true when the tumor is located deep within the body, as the high-dose regions extend beyond the anterior/posterior boundaries of the target, and the peak dose lies outside the target volume. As a result, this can lead to a relatively high dose, delivered to the OARs surrounding the GTV [ 5 ]. However, arc-based approaches can confine high-dose regions within the tumour, thereby minimizing damage to the surrounding healthy tissue. In this regard, 2D-SFRT with cylindrical targets performed better than 3D-LRT in reducing unnecessary exposure to the lungs (Figure 3). Given the potential for increased dose to surrounding OARs in both treatment methods, we calculated NTCP values for normal tissues to quantify the risk of radiation-induced complications and assess the clinical safety of each approach. The probability of complications in normal tissues for both plans was negligible (Tables 3 and 4). The NTCP values indicate that VMAT-based grid therapy plans for lung tumors can be delivered without causing significant side effects or toxicity. By maximizing the protection of areas outside the GTV, other treatment options remain feasible, and patients who receive SFRT in conjunction with supplemental radiotherapy often achieve better treatment outcomes [ 11 , 31 , 32 ].
Conclusion
Both VMAT-based SFRT plans are effective in delivering high doses to very small, well-defined areas within the GTV while creating steep dose gradients. It was also demonstrated that although the 2D-SFRT may provide a higher average dose and EUD, the 3D-LRT approach may offer a greater therapeutic ratio and a more consistent valley-to-peak dose distribution within the GTV. The probability of complications in surrounding normal tissues was nearly zero for both treatment plans. This highlights the efficacy of both techniques in minimizing normal tissue complications. Additionally, it was shown that the prescribed dose has a greater impact on the dosimetric and therapeutic outcomes than the grid target geometry. These findings could significantly influence radiotherapy treatment planning for VMAT-based-SFRT, providing valuable insights for selecting the appropriate therapeutic planes.
Authors’ Contribution
E. Balvasi performed treatment planning, analyzed the data, and wrote the manuscript. F. Mahmoudi contributed to the concept and design of the treatment plans and supervised the data analysis. P. Farnia selected the CT scan images of patients’ lungs suitable for SFRT. F. Jafari performed image contouring and evaluated the treatment plans. A. Ameri assessed the image contours. Gh. Geraily supervised the treatment planning process and gave final approval for the manuscript. All authors reviewed and approved the final manuscript.
Ethical Approval
Ethical approval was obtained from the Ethics Committee of Tehran University of Medical Sciences (Ethics code: IR.TUMS.IKHC.REC.1402.160).
Informed Consent
This study adhered to the institutional research committee’s ethical requirements in all human subject procedures.
Funding
This work was supported by the Tehran University of Medical Sciences, Tehran, Iran [grant number TUMS-68250].
Conflict of Interest
None
References
- Yan W, Khan MK, Wu X, Simone CB 2nd, Fan J, Gressen E, et al. Spatially fractionated radiation therapy: History, present and the future. Clin Transl Radiat Oncol. 2019; 20:30-8. Publisher Full Text | DOI | PubMed [ PMC Free Article ]
- Griffin RJ, Ahmed MM, Amendola B, Belyakov O, Bentzen SM, Butterworth KT, et al. Understanding High-Dose, Ultra-High Dose Rate, and Spatially Fractionated Radiation Therapy. Int J Radiat Oncol Biol Phys. 2020; 107(4):766-78. DOI | PubMed
- Grams MP, Deufel CL, Kavanaugh JA, Corbin KS, Ahmed SK, Haddock MG, et al. Clinical aspects of spatially fractionated radiation therapy treatments. Phys Med. 2023; 111:102616. DOI | PubMed
- Mahmoudi F, Mohammadi N, Haghighi M, Alirezaei Z, Jabbari I, Chegeni N, et al. How much should you worry about contaminant neutrons in spatially fractionated grid radiation therapy? PLoS One. 2023; 18(1):e0280433. Publisher Full Text | DOI | PubMed [ PMC Free Article ]
- Mahmoudi F, Shahbazi-Gahrouei D, Chegeni N. The role of the spatially fractionated radiation therapy in the management of advanced bulky tumors. Polish Journal of Medical Physics and Engineering. 2021; 27(2):123-35. DOI
- Peñagarícano JA, Griffin R, Corry P, Moros E, Yan Y, Ratanatharathorn V. Spatially fractionated (GRID) therapy for large and bulky tumors. J Ark Med Soc. 2009; 105(11):263-5. PubMed
- Zhang X, Griffin RJ, Galhardo EP, Penagaricano J. Feasibility Study of 3D-VMAT-Based GRID Therapy. Technol Cancer Res Treat. 2022; 21:1-8. Publisher Full Text | DOI | PubMed [ PMC Free Article ]
- Billena C, Khan AJ. A Current Review of Spatial Fractionation: Back to the Future? Int J Radiat Oncol Biol Phys. 2019; 104(1):177-87. Publisher Full Text | DOI | PubMed [ PMC Free Article ]
- Larrea L, Gonzalez V, Lopez E, Antonini P. Lattice Radiotherapy (LRT) Protocol: Valencia Protocol. Cureus Journal of Medical Science. 2022; 14(2)
- Wu X, Perez NC, Zheng Y, Li X, Jiang L, Amendola BE, et al. The Technical and Clinical Implementation of LATTICE Radiation Therapy (LRT). Radiat Res. 2020; 194(6):737-46. DOI | PubMed
- Grams MP, Owen D, Park SS, Petersen IA, Haddock MG, Jeans EB, et al. VMAT Grid Therapy: A Widely Applicable Planning Approach. Pract Radiat Oncol. 2021; 11(3):e339-47. DOI | PubMed
- Karimi AH, Mirian SF, Mahmoudi F, Geraily G, Vega-Carrillo HR, Mohiuddin M. Feasibility of 18-MV grid therapy from radiation protection aspects: unwanted dose and fatal cancer risk caused by photoneutrons and scattered photons. Comput Methods Programs Biomed. 2022; 213:106524. DOI | PubMed
- Mahmoudi F, Shahbazi-Gahrouei D, Chegeni N, Saeb M, Sadeghi V, Hemati S. Potential implications of the radiation-induced bystander effect for spatially fractionated radiotherapy: A theoretical simulation study. International Journal of Radiation Research. 2022; 20(3):657-64. DOI
- Sheikh K, Hrinivich WT, Bell LA, Moore JA, Laub W, Viswanathan AN, et al. Comparison of treatment planning approaches for spatially fractionated irradiation of deep tumors. J Appl Clin Med Phys. 2019; 20(6):125-33. Publisher Full Text | DOI | PubMed [ PMC Free Article ]
- Cahoon P, Giacometti V, Casey F, Russell E, McGarry C, Prise KM, McMahon SJ. Investigating spatial fractionation and radiation induced bystander effects: a mathematical modelling approach. Phys Med Biol. 2021; 66(22):225007. DOI | PubMed
- Kutcher GJ, Burman C, Brewster L, Goitein M, Mohan R. Histogram reduction method for calculating complication probabilities for three-dimensional treatment planning evaluations. Int J Radiat Oncol Biol Phys. 1991; 21(1):137-46. DOI | PubMed
- Burman C, Kutcher GJ, Emami B, Goitein M. Fitting of normal tissue tolerance data to an analytic function. Int J Radiat Oncol Biol Phys. 1991; 21(1):123-35. DOI | PubMed
- Zhang H, Zhong H, Barth RF, Cao M, Das IJ. Impact of dose size in single fraction spatially fractionated (grid) radiotherapy for melanoma. Med Phys. 2014; 41(2):021727. DOI | PubMed
- Ha JK, Zhang G, Naqvi SA, Regine WF, Yu CX. Feasibility of delivering grid therapy using a multileaf collimator. Med Phys. 2006; 33(1):76-82.
- Zhang H, Wang JZ, Mayr N, Kong X, Yuan J, Gupta N, et al. Fractionated grid therapy in treating cervical cancers: conventional fractionation or hypofractionation? Int J Radiat Oncol Biol Phys. 2008; 70(1):280-8. DOI | PubMed
- Mohiuddin M, Park H, Hallmeyer S, Richards J. High-Dose Radiation as a Dramatic, Immunological Primer in Locally Advanced Melanoma. Cureus. 2015; 7(12):e417. Publisher Full Text | DOI | PubMed [ PMC Free Article ]
- Kanagavelu S, Gupta S, Wu X, Philip S, Wattenberg MM, Hodge JW, et al. In vivo effects of lattice radiation therapy on local and distant lung cancer: potential role of immunomodulation. Radiat Res. 2014; 182(2):149-62. Publisher Full Text | DOI | PubMed [ PMC Free Article ]
- Lee Y, Auh SL, Wang Y, Burnette B, Wang Y, Meng Y, et al. Therapeutic effects of ablative radiation on local tumor require CD8+ T cells: changing strategies for cancer treatment. Blood. 2009; 114(3):589-95. Publisher Full Text | DOI | PubMed [ PMC Free Article ]
- Park SS, Dong H, Liu X, Harrington SM, Krco CJ, Grams MP, et al. PD-1 Restrains Radiotherapy-Induced Abscopal Effect. Cancer Immunol Res. 2015; 3(6):610-9. Publisher Full Text | DOI | PubMed [ PMC Free Article ]
- Peng V, Suchowerska N, Esteves ADS, Rogers L, Claridge Mackonis E, Toohey J, McKenzie DR. Models for the bystander effect in gradient radiation fields: Range and signalling type. J Theor Biol. 2018; 455:16-25. DOI | PubMed
- Peng V, Suchowerska N, Rogers L, Claridge Mackonis E, Oakes S, McKenzie DR. Grid therapy using high definition multileaf collimators: realizing benefits of the bystander effect. Acta Oncol. 2017; 56(8):1048-59. DOI | PubMed
- Asur R, Butterworth KT, Penagaricano JA, Prise KM, Griffin RJ. High dose bystander effects in spatially fractionated radiation therapy. Cancer Lett. 2015; 356(1):52-7. Publisher Full Text | DOI | PubMed [ PMC Free Article ]
- Zhang X, Penagaricano J, Yan Y, Sharma S, Griffin RJ, Hardee M, Han EY, Ratanatharathom V. Application of Spatially Fractionated Radiation (GRID) to Helical Tomotherapy using a Novel TOMOGRID Template. Technol Cancer Res Treat. 2016; 15(1):91-100. DOI | PubMed
- Jin JY, Zhao B, Kaminski JM, Wen N, Huang Y, Vender J, et al. A MLC-based inversely optimized 3D spatially fractionated grid radiotherapy technique. Radiother Oncol. 2015; 117(3):483-6. DOI | PubMed
- Mahmoudi F, Chegeni N, Bagheri A, Fatahi Asl J, Batiar MT. Impact of radiobiological models on the calculation of the therapeutic parameters of Grid therapy for breast cancer. Appl Radiat Isot. 2021; 174:109776. DOI | PubMed
- Mohiuddin M, Stevens JH, Reiff JE, Huq MS, Suntharalingam N. Spatially fractionated (GRID) radiation for palliative treatment of advanced cancer. Radiation Oncology Investigations: Clinical and Basic Research. 1996; 4(1):41-7. DOI
- Mohiuddin M, Fujita M, Regine WF, Megooni AS, Ibbott GS, Ahmed MM. High-dose spatially-fractionated radiation (GRID): a new paradigm in the management of advanced cancers. Int J Radiat Oncol Biol Phys. 1999; 45(3):721-7. DOI | PubMed


