Introduction
Cerebral gliomas are the most common primary malignant brain tumors, representing a significant challenge in neuro-oncology, due to their invasive nature. Despite progress in treatment, the prognosis for high-grade gliomas, particularly glioblastomas, remains poor [ 1 ]. Grading gliomas is crucial for guiding treatment selection, predicting outcomes, and improving patient care. Traditionally, grading is based on the histopathological analysis of biopsy samples, an invasive method that may not fully reflect the tumor’s complexity due to its heterogeneous nature. Consequently, there is increasing interest in non-invasive imaging techniques to better characterize gliomas and support clinical decisions [ 2 ].
Magnetic Resonance Imaging (MRI) is a widely utilized non-invasive imaging modality in medicine, particularly renowned for its effectiveness in diagnosing and managing brain diseases due to its capability to provide detailed anatomical and functional insights [ 3 ]. Among various MRI techniques, Intravoxel Incoherent Motion Diffusion-Weighted Imaging (IVIM-DWI) has recently gained prominence as a functional imaging method. This technique enables the acquisition of both diffusion and perfusion data from tissues without the need for contrast agents, offering crucial insights into tissue behavior [ 4 ]. Leveraging this information, IVIM-DWI has demonstrated its efficacy in numerous applications, including the diagnosis, grading, and prognostic evaluation of various malignancies, such as brain, liver, breast, prostate, lung, and pancreas [ 4 - 7 ].
Intravoxel Incoherent Motion (IVIM) imaging originates from Diffusion-Weighted Imaging (DWI) using multiple b-values, typically greater than eight b-value. By fitting the acquired data to a biexponential model, the diffusion coefficient (D), reflecting tissue diffusivity, and the perfusion fraction (f), along with the pseudo-diffusion coefficient (D*), which represents microvascular perfusion, can be extracted [ 8 ]. However, some studies have explored methods to improve the efficiency of IVIM analysis by reducing imaging and calculation times [ 9 - 11 ].
Theoretically, IVIM parameters can be estimated using as few as three b-values [ 9 - 11 ]. For instance, Cao et al. [ 9 ] investigated the effectiveness of IVIM-derived parameters for glioma tumor grading using three b-values. Similarly, Wang et al. [ 11 ] introduced a novel parameter called simple perfusion fraction (SPF) with three different b-value combination that can be used instead of f. The SPF leads to shorter imaging time and reduces computational effort. Additionally, Hino et al. [ 10 ] proposed a simplified approach for calculating D by using only two b-values, supported by a series of assumptions. Furthermore, with the appropriate selection of three b-values, the Apparent Diffusion Coefficient (ADC) parameter of DWI can also be effectively utilized.
Therefore, utilizing three b-values and simpler quantities can enhance the efficacy of IVIM studies by reducing imaging and calculation time. To the best of our knowledge, given the lack of a comprehensive study on simple quantities using a single database with a uniform approach for comparing results, this study aimed to use three b-values to extract simple quantities and compare them with the routine IVIM method.
Material and Methods
1) Patient Selection
This retrospective study received approval from the Institutional Review Board (IRB). Between May 2022 and August 2024, individuals with suspected gliomas, who had undergone brain MRI and were scheduled for neurosurgical resection, were evaluated for study participation. Individuals were excluded if they had a history of prior biopsies or treatments, or if they had contraindications to MRI, such as claustrophobia, metal implants, or pacemakers. A total of 30 patients with histologically confirmed gliomas were included (mean age±standard deviation, 46.4±12.1 years; 14 males, 16 females). Of these, 10 patients (mean age±standard deviation, 43.5±8.2 years; 6 males, 4 females) were diagnosed with Low-Grade Glioma (LGG; Grade II), and 20 patients (mean age±standard deviation, 46.7±10.3 years; 8 males, 12 females) were diagnosed with High-Grade Glioma (HGG; Grades III and IV.
2) MR Image Acquisition
All Magnetic Resonance (MR) images were acquired using a 1.5-T MRI scanner (Philips Medical Systems, Ingenia CX, 1.5T, Netherlands) equipped with an eight-channel head coil. The standard imaging protocol for brain tumors at our institution included non-contrast anatomic sequences, specifically T1-weighted, T2-weighted, and T2-Fluid-Attenuated Inversion Recovery (FLAIR) sequences, as well as contrast-enhanced T1-weighted imaging. For contrast enhancement, gadopentetate dimeglumine (Magnevist; Bayer Healthcare, Berlin, Germany) was administered intravenously.
IVIM images were acquired prior to contrast material administration. A single-shot Echo-Planar Imaging (EPI) sequence was employed with parameters set to a Repetition Time (TR) of 3000 ms and an Echo Time (TE) of 104 ms. Additional specifications included a section thickness of 5 mm, an intersection gap of 1 mm, and a Field of View (FOV) of 250×250 mm2, with a matrix size of 240×240. Twenty-five slices were acquired with b-values at increments of 0, 20, 50, 70, 100, 150, 200, 400, 800, and 1000 s/mm2. Each measurement was averaged twice, and the total acquisition time was approximately 7 minutes.
3) IVIM Image Analysis
The IVIM data were fitted to a biexponential model, as represented in Eq. 1.
In this equation, the signal intensity, denoted as Sb, is measured at a specific b-value, whereas S0 represents the signal intensity when b is equal to 0 s/mm². The parameter D quantifies the slow diffusion coefficient, which characterizes the motion of water molecules within the tissue’s cellular matrix. The perfusion fraction, f, represents the proportion of the signal attributed to microvascular blood flow, and the pseudo-diffusion coefficient, D*, accounts for the augmented diffusion resulting from microvascular perfusion effects. The data were fitted in one step to IVIM quantity [ 12 ].
4) Simplified Quantity
4-1) B-value Selection
The IVIM equation comprises two components: a perfusion component (f exp(-b×D*)) and a diffusion component ((1-f)exp(-b×D)). Several studies suggest that above a certain b-value threshold, the perfusion contribution in IVIM becomes negligible, and only the diffusion component plays a significant role. Various studies have identified this threshold to be around 200 s/mm2 [ 13 - 15 ]. In other hand, the b-value 0 and 1000 s/mm2 were commonly used in brian for ADC calculation in DWI imaging [ 1 ]. Therefore, we choose the b-values of 0, 200 and 1000 s/mm2 for simplified calculation.
4-2) IVIM Quantity
The IVIM parameters as describe in the Eq.1 were fitted in one step with this selelceted b-values. We indicated the extracted quantity of this methods with subscript of 3b in the future section (D3b, f3b,and D3b*).
4-3) ADC
The DWI data fitted to the monoexponential, as represented in Eq. 2 [ 1 ]. In this context, where Shigh is signal intensity at bhigh, and Slow is signal intensity at blow, respectively. Using the three b-values, we calculated three types of ADC combinations: of ADC0-200, ADC0-1000 and ADC200-1000.
ADC0-1000 represents the conventional ADC calculated in DWI imaging. By applying a b-value threshold of 200 s/mm² and neglecting the perfusion component of the IVIM model, the ADC200-1000 approximates the D in simplified models, with the assumption of negligible perfusion. We implement this simplification as detailed in Eq. 3.
for b-value>200=>
4-4) Simple Perfusion Fraction (SPF)
As described previously, the D200-1000 value reflects the diffusion characteristics of tissues, whereas ADC0-200 indicates both diffusion and perfusion. Therefore, the difference value between ADC0-200 and D200-1000 can be reasonably used as a measure of tissue perfusion, which was represented as the simple perfusion fraction and calculated as Eq. 4 [ 11 ].
5) Regions of Interest (ROI)
Regions of Interest (ROIs), for tumors were manually delineated by an experienced physicist (8 years’ experience in MR imaging) and confirmed by a radiologist (with over 13 years’ in radiology), using 3D-Slicer software’s segment editor module (version 4.10.2). On the largest tumor slice, circular ROIs, approximately 30 pixels in diameter, were drawn within the cancerous tissue, the edema, and the mirrored region of the cancerous tissue in the contralateral normal brain. The image with a b-value of 800 s/mm² was selected as the reference for drawing ROIs, and post-contrast enhanced 3D T1-weighted and T2-FLAIR images were employed to ensure the best selection of ROIs [ 16 ]. The mean value of each absolute quantity in the three different tissue types and the relative value of each to normal tissue are calculated.
6) Statistical Analysis Statistical Analysis
Correlations between simplified and routine IVIM parameters were assessed using the non-parametric Spearman rank correlation. Correlation coefficients were interpreted as follows: very weak (<0.2), weak (0.2–0.4), moderate (0.4–0.6), strong (0.6–0.8), and very strong (>0.8). For statistical comparisons, the two-tailed independent Student’s t-test was used for normally distributed variables, and the Mann-Whitney U-test was used for non-normally distributed data. Receiver Operating Characteristic (ROC) curve analysis was performed to determine diagnostic performance, including the Area Under the Curve (AUC), predicted cutoff values, sensitivity, and specificity, for parameters that exhibited statistically significant differences (P-value<0.05) between low- and high-grade gliomas. All statistical analyses were performed using SPSS (version 15.0) software, with statistical significance set at P-value<0.05.
Results
Routine Methods
The values of IVIM parameters across high and low grades, calculated using all data in a one-step approach, are presented in Table 1. Table 1 reveals a significant difference in parameter D specifically within the cancerous tissue region. No significant differences were observed in the edema or normal tissue regions. As expected, the value of parameter D was higher in LGG than in HGG within the cancerous tissue. Parameters f and D* also exhibited a similar pattern using this computational method. The value of parameter f is higher in HGG compared to LGG, while parameter D* exhibits the opposite behavior.
| IVIM Quantity | Tissue | Mean in LGG | Mean in HGG | P-value |
|---|---|---|---|---|
| D (×10-3) | Cancer | 1.74 | 1.18 | 0.041 |
| Edema | 1.23 | 1.35 | 0.532 | |
| Normal | 0.99 | 0.67 | 0.447 | |
| f (%) | Cancer | 12.90 | 19.97 | 0.007 |
| Edema | 14.89 | 12.80 | 0.486 | |
| Normal | 13.56 | 11.92 | 0.425 | |
| D* (×10-3) | Cancer | 46.45 | 30.41 | 0.036 |
| Edema | 46.33 | 47.47 | 0.484 | |
| Normal | 40.74 | 38.43 | 0.734 | |
| IVIM: Intravoxel Incoherent Motion, LGG: Low-Grade Glioma, HGG: High-Grade Glioma | ||||
Simplified and Routine Method Correlation
In the first step of analyzing the simplified method’s data, the correlation between the simplified and routine IVIM parameters was examined. Their Spearman correlation results indicate that the quantity D has a strong correlation with the quantities D3b, ADC0-1000, ADC0-200, and ADC200-1000. Similarly, correlations were observed between parameter f and SPF, and f3b, as well as between D* and D3b*. Among these, parameter D3b showed the strongest correlation with parameter D, with a coefficient of 0.733. The results of this correlation analysis are presented in Figure 1.
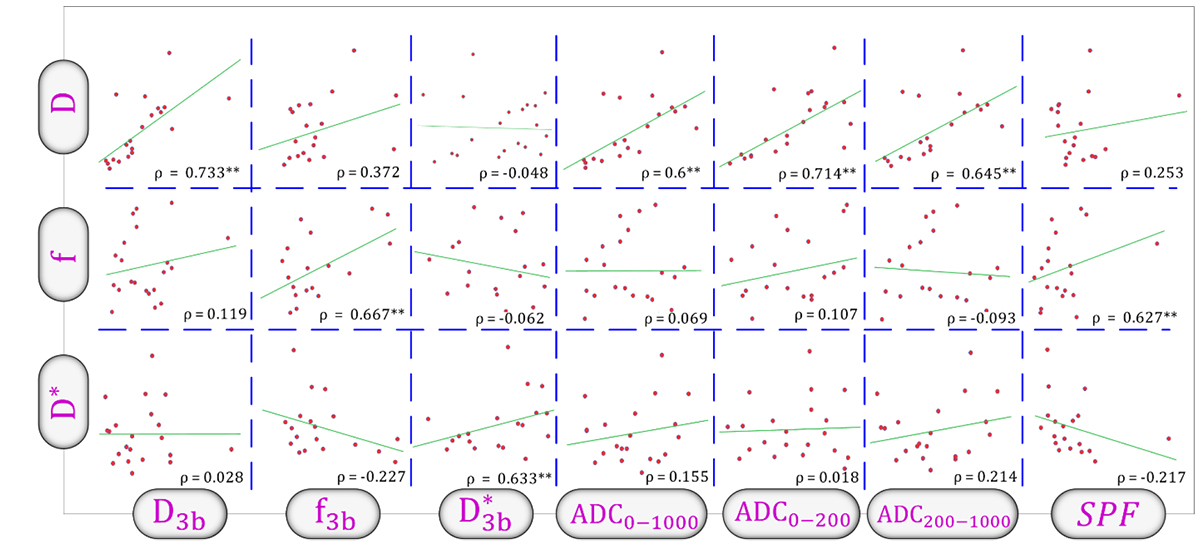
Figure 1. Scatterplot matrix showing correlations between routine Intravoxel Incoherent Motion (IVIM) parameters (D, f, D*) and simplified IVIM metrics. The D3b, f3b, D3b*, Apparent Diffusion Coefficient (ADC) and Simple Perfusion Fraction (SPF) are the simplified metrics. Spearman’s rank correlation coefficients (ρ) are displayed in each scatterplot, with significant correlations (P<0.05) denoted by an asterisk (*).
Simplified Methods
The results of examining IVIM parameters calculated using three b-values demonstrated that their behavior was largely similar to that of parameters calculated using the conventional method (Table 2). However, a more detailed analysis revealed that the three b-value approach slightly overestimated D3b and slightly underestimated f3b and D3b*. Furthermore, this method enabled differentiation between glioma grades using parameter f in the edema region. Additionally, the value of parameter D3b* was higher in HGG than in LGG, whereas the opposite trend was observed with the conventional method.
| IVIM Quantity | Tissue | Mean in LGG | Mean in HGG | P-value |
|---|---|---|---|---|
| D3b (×10-3) | Cancer | 2.59 | 1.11 | 0.046 |
| Edema | 1.70 | 1.33 | 0.879 | |
| Normal | 0.76 | 0.73 | 0.738 | |
| f3b (%) | Cancer | 5.15 | 7.20 | 0.036 |
| Edema | 4.55 | 6.23 | 0.016 | |
| Normal | 5.30 | 5.57 | 0.648 | |
| D3b* (×10-3) | Cancer | 22.34 | 27.05 | 0.047 |
| Edema | 25.06 | 28.95 | 0.080 | |
| Normal | 21.49 | 22.10 | 0.299 | |
| IVIM: Intravoxel Incoherent Motion, LGG: Low-Grade Glioma, HGG: High-Grade Glioma | ||||
Examination of ADC (ADC0-1000, ADC200-1000) and SPF parameters also revealed similar behavior (Table 3). These quantities, when assessed within the cancerous region, also showed significant differences. However, the quantity ADC0-200 does not demonstrate the ability to create significant differences, even within the cancerous region. Conversely, the SPF parameter provided differentiation even in the edema region.
| IVIM Quantity | Tissue | Mean in LGG | Mean in HGG | P-value |
|---|---|---|---|---|
| ADC0-1000 (×10-3) | Cancer | 1.14 | 1.03 | 0.033 |
| Edema | 1.33 | 1.23 | 0.982 | |
| Normal | 0.79 | 0.79 | 0.692 | |
| ADC200-1000 (×10-3) | Cancer | 0.68 | 0.75 | 0.041 |
| Edema | 0.54 | 0.68 | 0.648 | |
| Normal | 0.41 | 0.43 | 0.243 | |
| ADC (×10-3) | Cancer | 1.41 | 1.33 | 0.484 |
| Edema | 1.48 | 1.58 | 0.549 | |
| Normal | 0.98 | 1.00 | 0.784 | |
| SPF(%) | Cancer | 31.76 | 38.02 | 0.071 |
| Edema | 29.14 | 36.77 | 0.060 | |
| Normal | 25.85 | 23.51 | 0.784 | |
| IVIM: Intravoxel Incoherent Motion, LGG: Low-Grade Glioma, HGG: High-Grade Glioma | ||||
Some studies have indicated that normalizing data to the mirrored region on the contralateral side of the cancer can improve the differentiation of differences [ 2 , 4 ]. However, the results of our study showed that dividing cancerous and edema data by the value of the normal region did not yield any significant differences, and even the significance of many parameters was altered. The results of the ratio of parameters to the normal tissue value are presented in Figure 2. The results in the Figure 2 indicate that, for the cancerous region, only two quantities, f and D3b, are capable of creating significant differences with this approach.
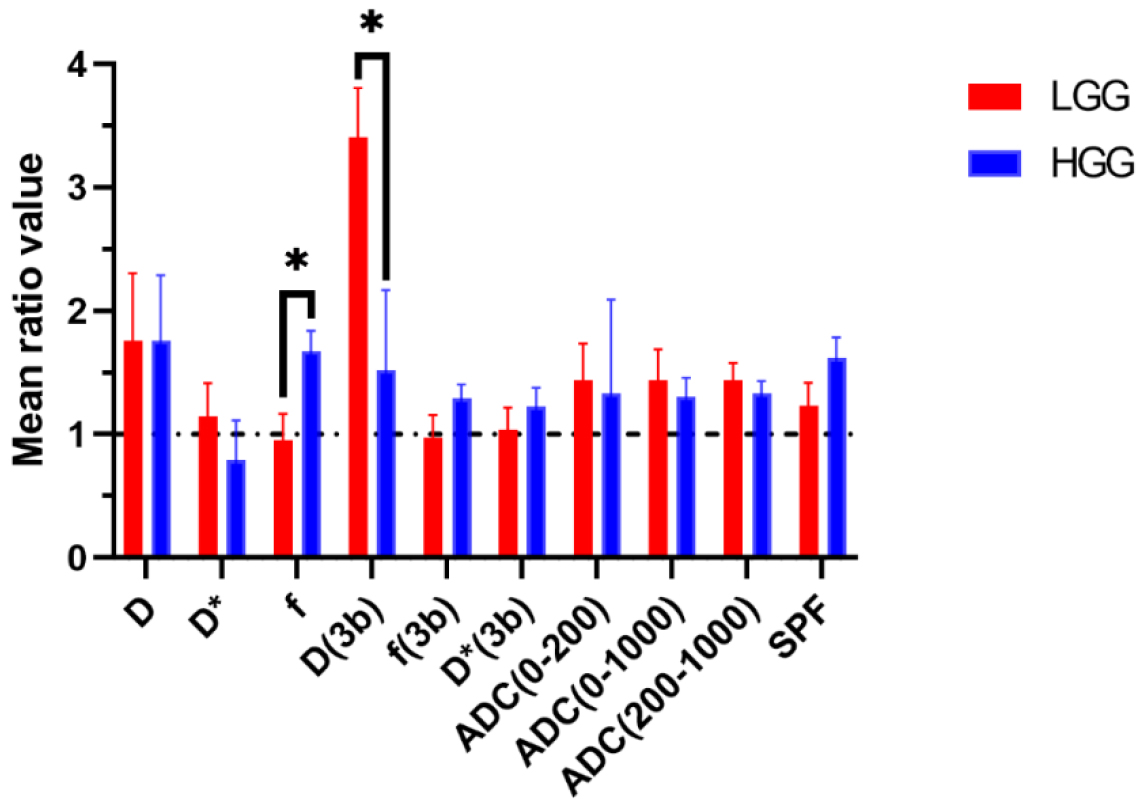
Figure 2. Different Intravoxel Incoherent Motion (IVIM) quantities (D, f, and D*) in cancerous tissue normalized to corresponding values in normal tissue. The D3b, f3b, D3b*, Apparent Diffusion Coefficient (ADC) and simple perfusion fraction (SPF) are the simplified metrics. Significant differences are indicated with asterisks (*).
To enhance the efficacy of these data in grading, we have examined the sensitivity, specificity, the AUC of ROC curve, and the cut-off values of the quantities that demonstrated significant differences in the cancerous region (Table 4). Table 4 is sorted from the highest to the lowest AUC values. As shown in Table 4, the parameters ADC200-1000 and SPF exhibited the best performance, while the simplified parameter D3b* showed the worst performance. However, the other parameters did not show substantial differences in their ability to differentiate grades, based on AUC values. The generated maps for each parameter in the high and low grades are presented in Figures 3 and 4.
| Quantity | Sensitivity (%) | Specificity (%) | AUC (%) | Cut off |
|---|---|---|---|---|
| ADC200-1000 (×10-3) | 100.0 | 75.0 | 85.3 | 0.25 |
| SPF(%) | 79.7 | 85.0 | 77.2 | 36.42 |
| f(%) | 100.0 | 60.0 | 76.7 | 15.98 |
| ADC0-1000 (×10-3) | 83.3 | 80.0 | 75.0 | 1.1 |
| D3b (×10-3) | 83.3 | 65.0 | 71.3 | 1.22 |
| D* (×10-3) | 100.0 | 60.0 | 70.8 | 26.51 |
| D (×10-3) | 100.0 | 59.0 | 70.7 | 0.76 |
| f3b(%) | 66.7 | 80.0 | 70.2 | 4.77 |
| rD3b | 84.6 | 68.4 | 69.2 | 2.1 |
| rf | 88.3 | 66.0 | 67.3 | 1.1 |
| D3b* (×10-3) | 83.3 | 65.0 | 66.8 | 25.4 |
| AUC: Area Under Curve, ADC: Apparent Diffusion Coefficient | ||||
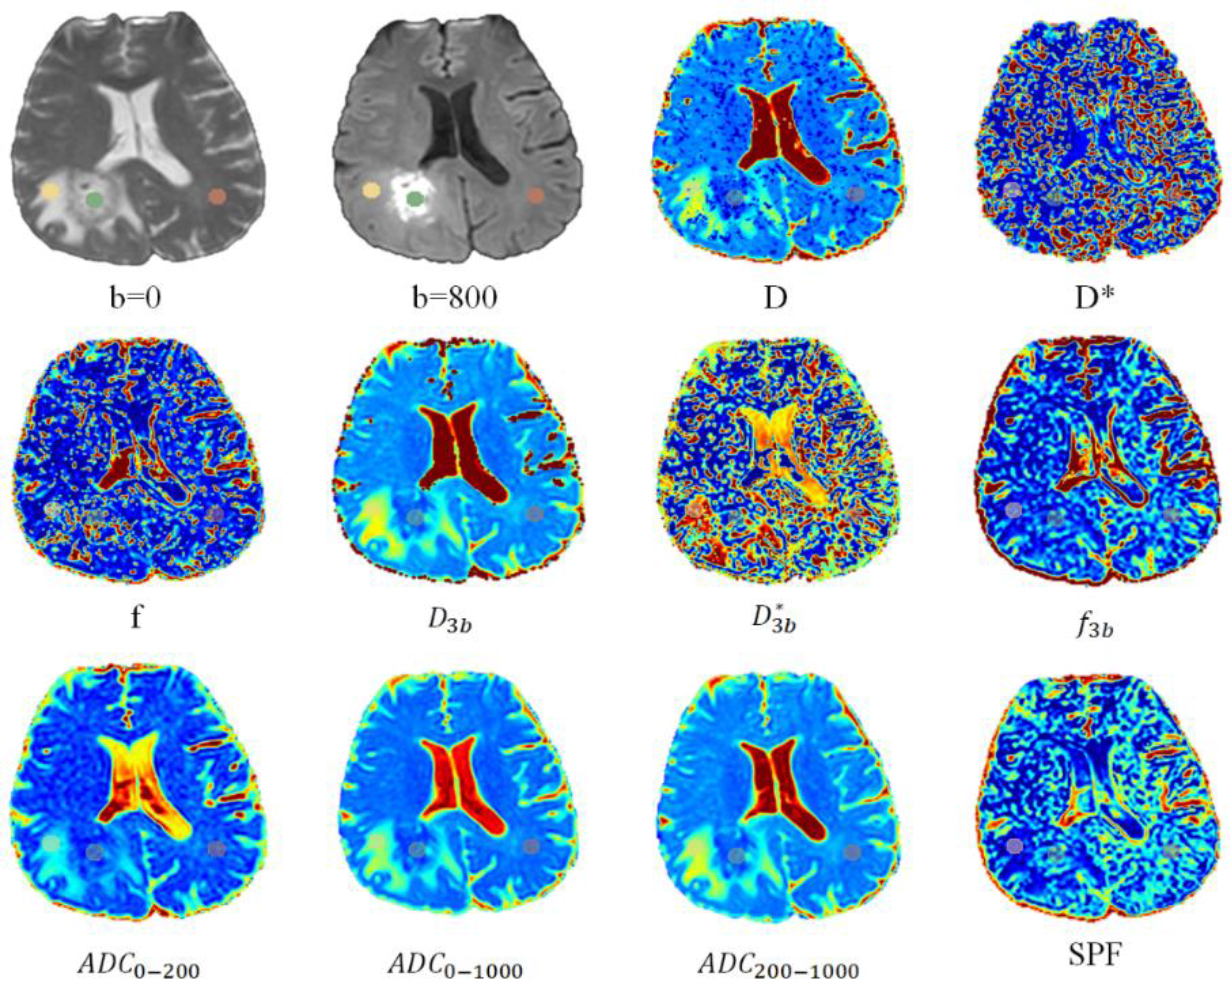
Figure 3. Axial slices from a high-grade glioma patient, showing varying quantities. Regions of Interest (ROIs) are delineated with green circles for cancer, yellow for edema, and purple for normal tissue. (ADC: Apparent Diffusion Coefficient, SPF: Simple Perfusion Fraction)
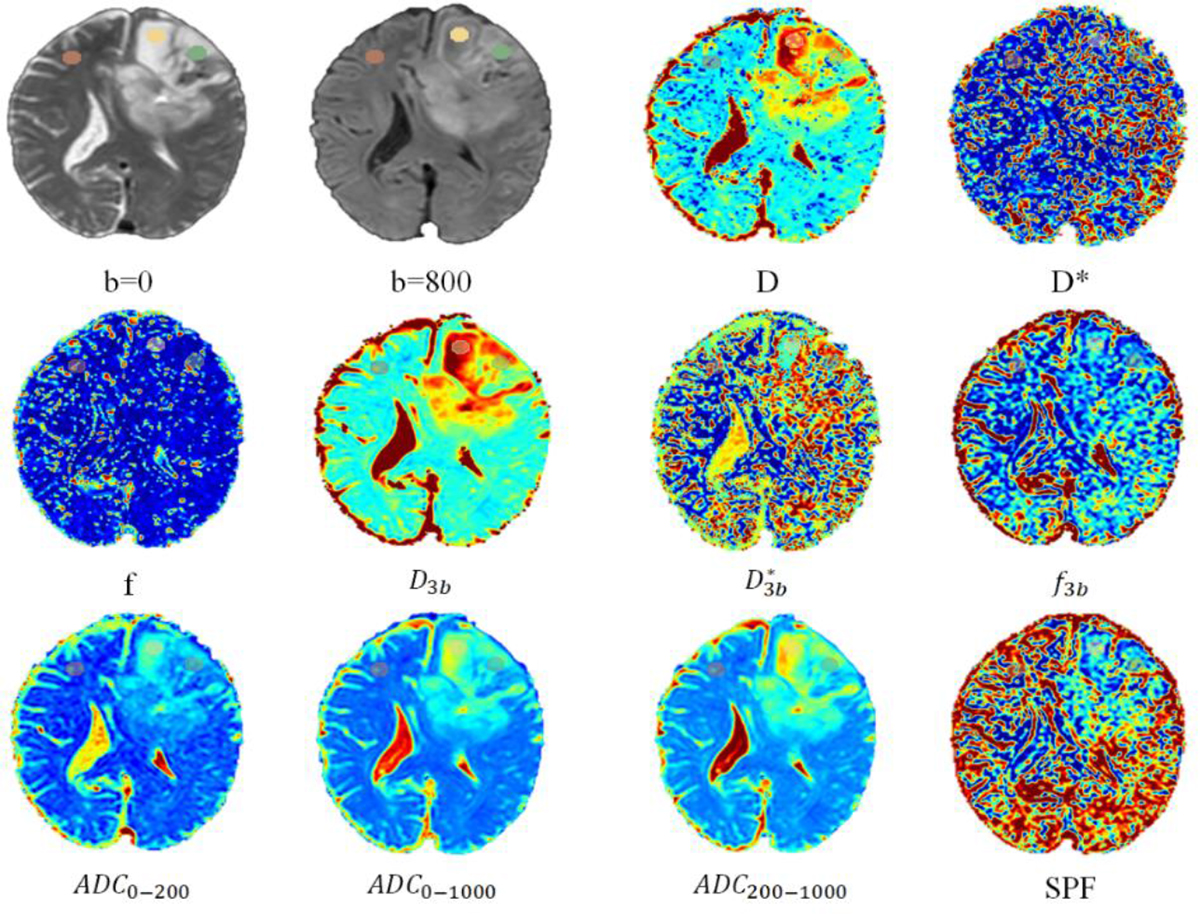
Figure 4. Axial slices from a low-grade glioma patient, showing varying quantities. Regions of Interest (ROIs) are delineated with green circles for cancer, yellow for edema, and purple for normal tissue. (ADC: Apparent Diffusion Coefficient, SPF: Simple Perfusion Fraction)
Discussion
Simplification of IVIM imaging can not only reduce acquisition time but also streamline its calculations, thereby enhancing its efficiency and facilitating its wider clinical application. To this end, we investigated all techniques that can be derived using three b-values, and we obtained parameter values in three regions: cancerous tissue, edema, and normal tissue.
In the first step, we obtained the IVIM parameters in their routine state. The parameter D quantifies the actual diffusion of water molecules, providing insights into cellular density and the presence of barriers to diffusion. In brain tumors, a lower D value typically corresponds to higher cellular density, which is often associated with more aggressive tumors. The parameter f represents the proportion of water molecules, exhibiting rapid pseudo-diffusion, primarily related to blood volume within the capillary network [ 1 ]. Elevated f values generally indicate increased vascularity and angiogenesis, common characteristics of malignant tumors [ 9 ]. Finally, D* measures the fast diffusion component linked to microvascular perfusion, reflecting the speed of blood flow within capillaries, which potentially could be higher in HGG [ 2 ].
Our results are consistent with those of other studies [ 1 , 2 , 9 , 15 , 17 , 18 ] and indicate that the D values are lower in HGG compared to LGG. In contrast, the parameter f is higher in HGG than in LGG. The current investigation revealed that D* values were elevated in the LGG group, a result consistent with the findings of Zou et al. [ 19 ]. However, this observation contrasts with those reported in other studies [ 1 , 2 , 13 ]. This discrepancy may be attributed to several factors. First, while we employed a circular selection strategy for hotspot ROI, the inherent heterogeneity of gliomas may still influence D* values, as microvascular perfusion can vary even within hotspots. Second, D* is known to be sensitive to noise and artifacts, and its estimation can be affected by Signal Noise Ratio (SNR) levels, the choice of low b-values, and the challenges of nonlinear model fitting [ 4 , 19 , 20 ]. Previous research has also indicated that D* exhibits limited reliability among the various IVIM parameters due to its susceptibility to these factors.
To reduce imaging time and increase efficiency, the primary approach is to use a smaller number of b-values to obtain IVIM parameters. We accomplished this by using three b-values (0, 200, and 1000). This three-b-value method has also been used for other cancers, such as head and neck tumors, liver cirrhosis, and hepatocellular carcinomas [ 21 - 23 ]. The analysis of IVIM results derived from this method demonstrates a consistent trend in the D3b and f3b parameters, mirroring that observed in routine measurements. However, the D3b* exhibits higher values in HGG compared to LGG when using this method. It is important to note that D* is a parameter associated with a lower degree of confidence [ 4 , 19 ]. Furthermore, a more detailed examination of these values indicates that the three b-value approach tends to slightly overestimate D_3b while concurrently slightly underestimate both f3b and D3b*. Hino et al. [ 10 ] also observed this underestimation in the quantity of f using three b-values (0, 300, and 1000). In their study [ 10 ], they showed that the AUC for their D quantity was 77.1%, while the f quantity performed better, reaching an AUC of 99%. The potential underestimation of the f-value may arise from the impact of residual perfusion effects on the SI measured at the chosen b-value [ 10 ]. Research has explored the reliability of parameters D and f, as well as their dependence on b-value distributions using three b-value protocol. It appears that D3b values might be less affected by perfusion, as regions of high f3b do not consistently align with areas of low D3b [ 24 ].
The estimation of IVIM parameters is subject to the influence of several factors, including the selected ROIs [ 25 ], the number and distribution of b-values [ 1 , 2 , 26 ], the fitting methods used [ 4 ], the b-value threshold for segmentation fitting [ 9 , 10 ], voxel size [ 15 ], MRI field strength [ 27 ], and the TR and TE of the imaging sequence [ 28 ]. Variations in these parameters contribute to discrepancies observed in study results.
The ADC, as a well-established metric in DWI, is widely used in DWI, and studies have sought to introduce more optimized ADC metrics for various purposes, such as grading and the expression of different genes [ 29 , 30 ]. The use of ADC can significantly reduce imaging time and computations. For example, the results of a study by Nuessle et al. [ 30 ] indicate that higher ADC500-2500 values can better predict isocitrate dehydrogenase 1 (IDH-1) mutatiaon and 1p/19 co-deletion. Our study results also demonstrate that using ADC calculated with b-values of 200 and 1000 (ADC200-1000) provided the best performance with an AUC of 85%. However, it should be noted that in the brain, for b-values below 200, perfusion effects, in addition to diffusion effects, play a significant role [ 13 - 15 ]. The values of metrics calculated with b-values below this threshold, such as ADC0-200 and ADC0-1000 calculated in our study, will be influenced by both of these effects. Therefore, for applications requiring the assessment of either perfusion or diffusion information alone, these metrics may not be suitable. Considering that ADC200-1000 has shown superior performance compared to ADC0-1000, commonly known as conventional ADC in DWI, and provides a more accurate representation of tissue diffusion characteristics, and it can be used as a replacement for conventional ADC.
The SPF represents the relative contribution of pseudo-diffusion to the overall diffusion signal. Consequently, a correlation between SPF and the f derived from our study is expected. This finding aligns with the work of Cao et al. [ 9 ], who demonstrated a correlation between SPF and both f (from IVIM) and ktrans (from dynamic contrast-enhanced MRI, a technique used to assess perfusion). Furthermore, prior studies have shown the predictive value of SPF in glioma grading [ 9 ] and IDH-1 mutation status [ 11 ]. The results of our study indicate that this metric could be a suitable alternative to the f, as also suggested in the other studies [ 9 , 11 ].
Conclusion
Our findings demonstrate that a simplified three b-value IVIM approach is a clinically feasible and effective method for glioma grading. The strong correlation between parameters derived from this simplified model and those from traditional IVIM, coupled with the superior diagnostic performance of ADC200-1000 and SPF, suggests that a reduced b-value acquisition scheme can provide significant diagnostic value. Furthermore, given that ADC0-1000 has shown superior performance compared to conventional ADC (ADC0-1000) in DWI and provides a more accurate representation of tissue diffusion characteristics, it should be considered a replacement for conventional ADC. This approach has the potential to reduce acquisition time and complexity, thereby facilitating the broader clinical implementation of IVIM imaging for glioma characterization and management.
Acknowledgment
The authors acknowledge the use of artificial intelligence tools, specifically OpenAI’s GPT-4, to assist in editing (grammar and native language) this manuscript. The authors take full responsibility for the integrity and accuracy of the content generated with the assistance of this technology. The current study is based on a PhD thesis that received support from the Deputy of Research and Technology at Mashhad University of Medical Sciences in Mashhad, Iran.
Authors’ Contribution
H. Akbari-Zadeh was involved in preparing, writing the original draft and editing. A. Montazerabdi and B. Ganjeifar conceived the presented idea and supervised the project. M. Maleki, S. Khoshbash, P. Lotfi gathered the data, and B. Aminzadeh and H. Akbari-Zadeh were involved in analyzing the data. All authors read, modified, and approved the final version of the manuscript.
Ethical Approval
This retrospective study was approved by the Institutional Review Board (IRB) of Mashhad University of Medical Sciences under protocol number IR.MUMS.MEDICAL.REC.1400.821.
Informed Consent
Informed consent was obtained from all patients prior to imaging.
Funding
This study received no external funding. All costs associated with this research were covered by the Vice Chancellor for Research of Mashhad University of Medical Sciences (Research Project Code: 4000863).
Conflict of Interest
None
References
- Wang X, Chen XZ, Shi L, Dai JP. Glioma grading and IDH1 mutational status: assessment by intravoxel incoherent motion MRI. Clin Radiol. 2019; 74(8):651e7-e14. DOI | PubMed
- Gu T, Yang T, Huang J, Yu J, Ying H, Xiao X. Evaluation of gliomas peritumoral diffusion and prediction of IDH1 mutation by IVIM-DWI. Aging (Albany NY). 2021; 13(7):9948-59. Publisher Full Text | DOI | PubMed [ PMC Free Article ]
- Abd-Ellah MK, Awad AI, Khalaf AAM, Hamed HFA. A review on brain tumor diagnosis from MRI images: Practical implications, key achievements, and lessons learned. Magn Reson Imaging. 2019; 61:300-18. DOI | PubMed
- Bagheri M, Ghorbani F, Akbari-Lalimi H, Akbari-Zadeh H, Asadinezhad M, Shafaghi A, Montazerabadi A. Histopathological graded liver lesions: what role does the IVIM analysis method have? MAGMA. 2023; 36(4):565-75.
- Gurney-Champion OJ, Klaassen R, Froeling M, Barbieri S, Stoker J, Engelbrecht MRW, et al. Comparison of six fit algorithms for the intra-voxel incoherent motion model of diffusion-weighted magnetic resonance imaging data of pancreatic cancer patients. PLoS One. 2018; 13(4):e0194590. Publisher Full Text | DOI | PubMed [ PMC Free Article ]
- Luo H, He L, Cheng W, Gao S. The diagnostic value of intravoxel incoherent motion imaging in differentiating high-grade from low-grade gliomas: a systematic review and meta-analysis. Br J Radiol. 2021; 94(1121):20201321. Publisher Full Text | DOI | PubMed [ PMC Free Article ]
- Zhang J, Zheng Y, Li L, Wang R, Jiang W, Ai K, Gan T, Wang P. Combination of IVIM with DCE-MRI for diagnostic and prognostic evaluation of breast cancer. Magn Reson Imaging. 2024; 113:110204. DOI | PubMed
- Liu ZC, Yan LF, Hu YC, Sun YZ, Tian Q, Nan HY, et al. Combination of IVIM-DWI and 3D-ASL for differentiating true progression from pseudoprogression of Glioblastoma multiforme after concurrent chemoradiotherapy: study protocol of a prospective diagnostic trial. BMC Med Imaging. 2017; 17(1):10. Publisher Full Text | DOI | PubMed [ PMC Free Article ]
- Cao M, Suo S, Han X, Jin K, Sun Y, Wang Y, et al. Application of a Simplified Method for Estimating Perfusion Derived from Diffusion-Weighted MR Imaging in Glioma Grading. Front Aging Neurosci. 2018; 9:432. Publisher Full Text | DOI | PubMed [ PMC Free Article ]
- Hino T, Togao O, Hiwatashi A, Yamashita K, Kikuchi K, Momosaka D, Honda H. Clinical efficacy of simplified intravoxel incoherent motion imaging using three b-values for differentiating high- and low-grade gliomas. PLoS One. 2018; 13(12):e0209796. Publisher Full Text | DOI | PubMed [ PMC Free Article ]
- Wang X, Cao M, Chen H, Ge J, Suo S, Zhou Y. Simplified perfusion fraction from diffusion-weighted imaging in preoperative prediction of IDH1 mutation in WHO grade II-III gliomas: comparison with dynamic contrast-enhanced and intravoxel incoherent motion MRI. Radiol Oncol. 2020; 54(3):301-10. Publisher Full Text | DOI | PubMed [ PMC Free Article ]
- Togao O, Hiwatashi A, Yamashita K, Kikuchi K, Mizoguchi M, Yoshimoto K, et al. Differentiation of high-grade and low-grade diffuse gliomas by intravoxel incoherent motion MR imaging. Neuro Oncol. 2016; 18(1):132-41. Publisher Full Text | DOI | PubMed [ PMC Free Article ]
- Bisdas S, Koh TS, Roder C, Braun C, Schittenhelm J, Ernemann U, Klose U. Intravoxel incoherent motion diffusion-weighted MR imaging of gliomas: feasibility of the method and initial results. Neuroradiology. 2013; 55(10):1189-96. DOI | PubMed
- Lin Y, Li J, Zhang Z, Xu Q, Zhou Z, Zhang Z, et al. Comparison of Intravoxel Incoherent Motion Diffusion-Weighted MR Imaging and Arterial Spin Labeling MR Imaging in Gliomas. Biomed Res Int. 2015; 2015:234245. Publisher Full Text | DOI | PubMed [ PMC Free Article ]
- Shen N, Zhao L, Jiang J, Jiang R, Su C, Zhang S, et al. Intravoxel incoherent motion diffusion-weighted imaging analysis of diffusion and microperfusion in grading gliomas and comparison with arterial spin labeling for evaluation of tumor perfusion. J Magn Reson Imaging. 2016; 44(3):620-32. DOI | PubMed
- Xing F, Wu G. Histogram analysis of intravoxel incoherent motion and dynamic contrast-enhanced MRI with the two-compartment exchange model in glioma. Int J Radiat Res. 2021; 19(3):505-14. DOI
- Federau C, Meuli R, O’Brien K, Maeder P, Hagmann P. Perfusion measurement in brain gliomas with intravoxel incoherent motion MRI. AJNR Am J Neuroradiol. 2014; 35(2):256-62. Publisher Full Text | DOI | PubMed [ PMC Free Article ]
- Keil VC, Mädler B, Gielen GH, Pintea B, Hiththetiya K, Gaspranova AR, et al. Intravoxel incoherent motion MRI in the brain: Impact of the fitting model on perfusion fraction and lesion differentiability. J Magn Reson Imaging. 2017; 46(4):1187-99. DOI | PubMed
- Zou T, Yu H, Jiang C, Wang X, Jiang S, Rui Q, et al. Differentiating the histologic grades of gliomas preoperatively using amide proton transfer-weighted (APTW) and intravoxel incoherent motion MRI. NMR Biomed. 2018; 31(1):10.1002/nbm.3850. Publisher Full Text | DOI | PubMed [ PMC Free Article ]
- Lipiński K, Bogorodzki P. Evaluation of Whole Brain Intravoxel Incoherent Motion (IVIM) Imaging. Diagnostics (Basel). 2024; 14(6):653. Publisher Full Text | DOI | PubMed [ PMC Free Article ]
- Lewin M, Fartoux L, Vignaud A, Arrivé L, Menu Y, Rosmorduc O. The diffusion-weighted imaging perfusion fraction f is a potential marker of sorafenib treatment in advanced hepatocellular carcinoma: a pilot study. Eur Radiol. 2011; 21(2):281-90. DOI | PubMed
- Luciani A, Vignaud A, Cavet M, Nhieu JT, Mallat A, Ruel L, et al. Liver cirrhosis: intravoxel incoherent motion MR imaging--pilot study. Radiology. 2008; 249(3):891-9. DOI | PubMed
- Sumi M, Van Cauteren M, Sumi T, Obara M, Ichikawa Y, Nakamura T. Salivary gland tumors: use of intravoxel incoherent motion MR imaging for assessment of diffusion and perfusion for the differentiation of benign from malignant tumors. Radiology. 2012; 263(3):770-7. DOI | PubMed
- Meeus EM, Novak J, Dehghani H, Peet AC. Rapid measurement of intravoxel incoherent motion (IVIM) derived perfusion fraction for clinical magnetic resonance imaging. MAGMA. 2018; 31(2):269-83. Publisher Full Text | DOI | PubMed [ PMC Free Article ]
- Wáng YXJ, Wang X, Wu P, Wang Y, Chen W, Chen H, Li J. Topics on quantitative liver magnetic resonance imaging. Quant Imaging Med Surg. 2019; 9(11):1840-90. Publisher Full Text | DOI | PubMed [ PMC Free Article ]
- Chabert S, Verdu J, Huerta G, Montalba C, Cox P, Riveros R, et al. Impact of b-Value Sampling Scheme on Brain IVIM Parameter Estimation in Healthy Subjects. Magn Reson Med Sci. 2020; 19(3):216-26. Publisher Full Text | DOI | PubMed [ PMC Free Article ]
- Li YT, Cercueil JP, Yuan J, Chen W, Loffroy R, Wáng YX. Liver intravoxel incoherent motion (IVIM) magnetic resonance imaging: a comprehensive review of published data on normal values and applications for fibrosis and tumor evaluation. Quant Imaging Med Surg. 2017; 7(1):59-78. Publisher Full Text | DOI | PubMed [ PMC Free Article ]
- Bisdas S, Klose U. IVIM analysis of brain tumors: an investigation of the relaxation effects of CSF, blood, and tumor tissue on the estimated perfusion fraction. MAGMA. 2015; 28(4):377-83. DOI | PubMed
- Hu YC, Yan LF, Sun Q, Liu ZC, Wang SM, Han Y, et al. Comparison between ultra-high and conventional mono b-value DWI for preoperative glioma grading. Oncotarget. 2017; 8(23):37884-95. Publisher Full Text | DOI | PubMed [ PMC Free Article ]
- Nuessle NC, Behling F, Tabatabai G, Castaneda Vega S, Schittenhelm J, Ernemann U, et al. ADC-Based Stratification of Molecular Glioma Subtypes Using High b-Value Diffusion-Weighted Imaging. J Clin Med. 2021; 10(16):3451. Publisher Full Text | DOI | PubMed [ PMC Free Article ]


