Introduction
Liver segmentation in Computed Tomography (CT) scan is an essential step in the diagnosis and treatment of hepatic disorders. However, this process faces several challenges, including partial volume effects, similarity in gray levels between the liver and adjacent organs, and variations in liver shape and size due to different pathologies [ 1 ]. Some methods have been proposed for liver segmentation in CT images, each with its advantages and limitations. Many of these methods rely on pre-trained models, which may fail in cases of atypical liver morphology, such as post-surgical changes or pathological conditions [ 2 ]. Traditional methods like thresholding and region-growing often fail in heterogeneous regions, while deep learning approaches require large annotated datasets [ 3 ]. In contrast, our hybrid method balances accuracy and computational efficiency.
Active contour models, notably the level set algorithm, have been widely used due to their ability to adapt to complex and heterogeneous shapes [ 4 ]. However, many of these methods depend on initial parameters and statistical models, which require manual tuning and may not perform consistently across different conditions.
This study aimed to develop a novel liver segmentation method that reduces dependency on pre-trained models and minimizes user intervention. Our approach combines texture features extracted from wavelet transforms with the level set algorithm. This combination allows the proposed method to automatically adapt to local variations in intensity and texture, improving segmentation accuracy.
In this paper, we first review the challenges and existing methods for liver segmentation. Then, we describe the proposed method and present the experimental results along with comparisons to other approaches.
Material and Methods
The proposed liver segmentation method consists of three main steps: (1) image quality improvement, (2) initial liver segmentation, and (3) final boundary refinement. Each step is detailed, along with the dataset and the proposed algorithm.
Dataset Description
The experiments were conducted using the SLIVER07 dataset (https://github.com/openmedlab/Awesome-Medical-Dataset/blob/main/resources/SLIVER07.md), a publicly available dataset, widely used for evaluating liver segmentation algorithms. The SLIVER07 benchmark dataset in our evaluation consists of 20 contrast-enhanced CT scans with expert-annotated liver boundaries. These scans cover diverse pathologies, including tumors and post-surgical changes, providing reliable ground truth for performance evaluation.
Each scan consists of approximately 100 slices, with in-plane resolutions ranging from 0.55 mm to 0.8 mm and slice thicknesses between 0.7 mm and 5.0 mm. The dataset covers a variety of liver shapes and sizes, including cases with tumours and post-surgical changes, making it suitable for testing the robustness of the proposed method.
Image Quality Improvement
In the first step, image quality is enhanced to facilitate accurate segmentation through three key operations: 1) noise reduction: a Gaussian filter with σ=1.5 and 3×3 kernel size is applied to suppress noise while preserving anatomical edges, 2) contrast enhancement: Histogram equalization with a clip limit of 0.03 is performed to improve tissue differentiation, and 3) region-based masking: a semi-automated masking technique using intensity thresholding (Hounsfield Unit range: -40 to 180) removes adjacent tissues with similar intensities, with morphological closing (5×5 circular structuring element) ensuring mask continuity.
Initial Liver Segmentation
The initial liver boundaries are identified using a combination of thresholding and Connected Component Labeling (CCL). First, an intensity threshold is applied to isolate the liver region based on prior knowledge of liver intensity values in Hounsfield units (typically between -40 and 180 HU). Next, the most significant connected component within the thresholded region is identified as the liver. Morphological operations, such as erosion and dilation, are then used to remove small holes and artifacts.
Final Boundary Refinement
The final liver boundaries are refined using a level set algorithm and wavelet-based texture features. Unlike traditional level set methods that rely on Gaussian kernels, our approach uses a wavelet energy distribution as the kernel. The wavelet energy distribution allows the algorithm to adapt to local texture variations, improving segmentation accuracy in heterogeneous regions.
The wavelet coefficients are extracted using a Discrete Wavelet Transform (DWT), and their energy distribution is modelled using the following Equation (1):
where α and β are segmentation parameters that model the variance and gradient decay rate, respectively. The variance (μ) and gradient decay rate (σ) parameters are calculated based on the skewness of wavelet coefficients [ 5 ].
The level set function evolves by minimizing the following energy function in Equation 2:
where εr is the image energy term, μρ(φ) and ϑl(φ)are regularization terms, and μ and ϑ are positive constants.
Implementation
The initial contour for the level set algorithm is obtained through an automated two-step process. First, the preprocessed image is converted into a binary image using Otsu’s method to automatically determine the optimal threshold that separates the liver parenchyma from adjacent structures. Second, the largest connected component identified in the resulting binary mask is extracted and designated as the liver region, forming the initial contour. This approach is justified based on the anatomical assumption that the liver constitutes the largest connected organ mass in the CT slice after the initial preprocessing steps. Building on the wavelet-level set fusion framework, the segmentation is performed by embedding skewness-aware wavelet energy features into the level set evolution. The proposed algorithm operates through three sequential steps: 1) identifying the largest liver slice: the slice with the largest liver area is selected among all slices, 2) initial boundary detection: the initial boundary is identified in the largest liver slice using intensity thresholding, CCL, and morphological operations, 3) boundary refinement: the level set algorithm incorporates our proposed wavelet-adaptive kernel to improve boundary delineation in heterogeneous liver regions.
After the precise boundary is identified in the largest liver slice, it is used as the initialization for the subsequent slice. The steps of the proposed algorithm area shown in Figure 1.
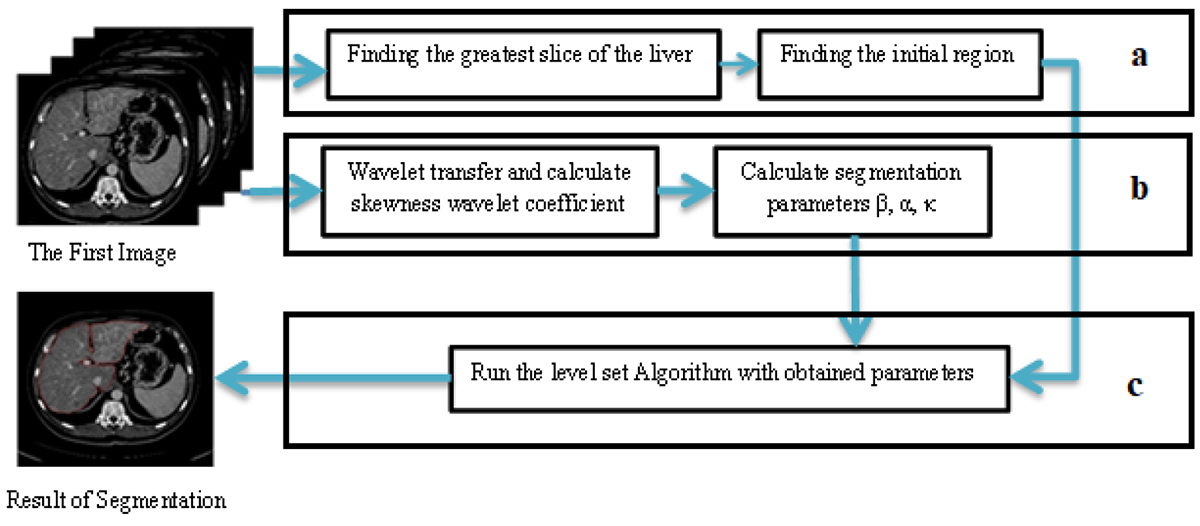
Figure 1. Pipeline of the proposed method: (a) Largest slice selection, (b) Initial boundary detection via thresholding/connected component labeling, (c) Final refinement using wavelet-level set fusion. (CT: Computed Tomography)
Identification of the Largest Liver Slice
The slice with the largest liver area has been chosen for initialization. To identify this slice, we utilized the method proposed by Foruzan et al. [ 6 ], which divides the entire image into blocks of 16×16 pixels. Intensity amounts in the liver CT images typically are defined between -40 to 180 Hounsfield units. In each block, pixels within the predefined intensity range (-40 to 180 HU) are counted. If at least half of the pixels in a block fall within this range, the block is classified as part of the liver. This concept is expressed in the Equation 3:
where n denotes the number of pixels within the predefined intensity range (-40 to 180 HU), and N represents the total number of pixels in the block.
In this paper, the greatest liver slice in the CT image is selected to initialize the curve. To minimize computational time, initialization is omitted for other slices, and the initial curve for these slices is derived from the output of the previous slice.
• Initialization
To determine the initial border, the image is thresholded using prior information about the liver’s intensity. After thresholding, the region where the liver constitutes the largest area remains. To obtain this region, the CCL algorithm is applied. However, the resulting image contains numerous artifacts, such as holes and regions adjacent to other organs, morphological operations are employed to eliminate these artifacts. Since the obtained region may still lack precision, it is used as the initial curve in the level set algorithm to refine the exact boundaries.
• Boundary Refinement
When the largest liver slice is initialized, Chunming Li’s local active contour algorithm determines the exact boundaries. The region obtained from the previous step serves as the initial curve. We apply the level set algorithm to the initial boundary, which minimizes the energy functional to achieve the optimal solution. In this article, the proposed method replaces the conventional Gaussian kernel with a novel wavelet-based kernel, specifically designed to enhance texture discrimination in liver CT segmentation.
If x∈r is an arbitrary pixel, and I(x):r→R2 is a CT image. The level set is evolved by minimizing the Equation 4.
In this formula, ν and μ are positive constants. ρ(φ) and l(φ) are the penalties term for regularization the curve. Finally εr is the image energy, into which we introduce the segmentation parameters obtained from the proposed method.
Results
We evaluated the proposed algorithm on the SLIVER07 benchmark dataset and compared its performance with state-of-the-art liver segmentation methods. The evaluation metrics included Volumetric Overlap Error (VOE), Relative Volume Difference (RVD), Average Symmetric Surface Distance (ASD), Root Mean Square Symmetric Surface Distance (RMSD), and Maximum Symmetric Surface Distance (MSD).
In the following sections, we present the quantitative results and provide a detailed comparative analysis.
Quantitative Results
The quantitative results of the proposed method are summarized in Table 1. Our approach achieved a VOE of 8.9% ± 0.8%, demonstrating statistically significant improvements over Oliveira et al. [ 7 ] (9.1% ± 0.9%, P-value=0.016) and Platero et al. [ 8 ] (10.8% ± 1.0%, P-value=0.003) in paired t-tests with Bonferroni correction. The RVD was 2.1% ± 0.5% (P-value=0.028 vs. baseline methods), confirming close agreement with ground truth volumes. Boundary delineation accuracy was highlighted by an ASD of 1.5 mm ± 0.3 mm (P-value=0.009), with all tests conducted at α=0.05 significance level. Statistical analysis confirmed the robustness of our method across 20 CT scans in the SLIVER07 dataset.
| Method | Volumetric Overlap Error (VOE, %) | Relative Volume Difference (RVD, %) | Average Symmetric Surface Distance (ASD, mm) | Root Mean Square Symmetric Distance (RMS, mm) | Maximum Symmetric Surface Distance (MSD, mm) |
|---|---|---|---|---|---|
| Proposed | 8.9±0.8 | 2.1±0.5 | 1.5±0.3 | 2.0±0.4 | 7.8±1.2 |
| Oliveira et al. [7] | 9.1±0.9 | 2.5±0.6 | 1.6±0.4 | 2.2±0.5 | 8.1±1.5 |
| Platero et al. [8] | 10.8±1.0 | 3.2±0.7 | 1.8±0.5 | 2.5±0.6 | 9.5±1.8 |
| Dawant et al. [9] | 11.2±1.2 | 3.5±0.8 | 2.0±0.6 | 2.7±0.7 | 10.0±2.0 |
The Root Mean Square Symmetric Surface Distance (RMS) was 2.0 mm, and the Maximum Symmetric Surface Distance (MSD) was 7.8 mm, indicating that the proposed method performs well even in challenging regions with complex boundaries.
Qualitative Results
Figure 2 shows a visual comparison of the segmentation results obtained by the proposed method and other state-of-the-art methods. The proposed method accurately captures the liver boundaries, even in regions with low contrast or adjacent organs with similar intensity values. In contrast, other methods tend to either over-segment or under-segment the liver, particularly in areas with tumors or post-surgical changes.
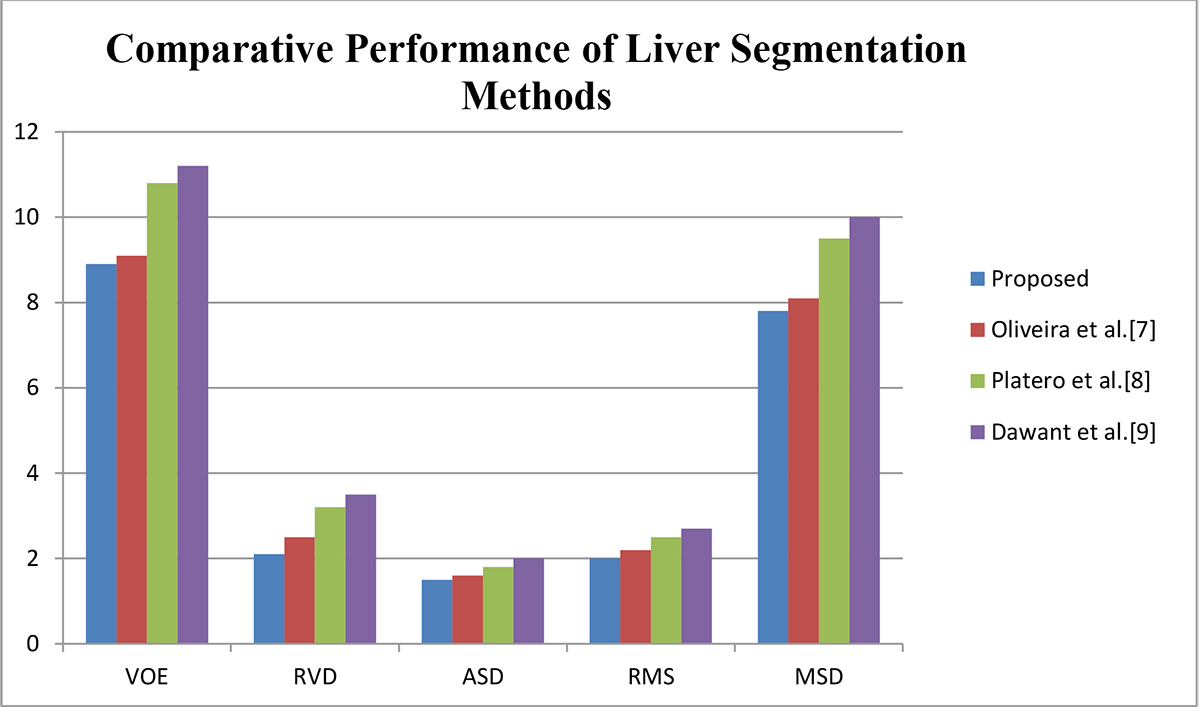
Figure 2. Visual and metric-based comparison of segmentation results. (VOE: Volumetric Overlap Error, RVD: Relative Volume Difference, ASD: Average Symmetric Surface Distance, RMS: Root Mean Square Symmetric Distance, MSD: Maximum Symmetric Surface Distance)
Statistical Analysis
To validate the statistical significance of our results, we performed a one-way ANOVA with Tukey’s post-hoc test for multiple comparisons across the three methods (Proposed, Oliveira et al. [ 7 ], Platero et al. [ 8 ], Dawant et al. [ 9 ]).
The ANOVA revealed significant overall differences (F(3,76)=5.42, P=0.002). Our method demonstrated statistically superior performance compared to Oliveira et al. [ 7 ] (VOE: P=0.011, RVD: P=0.017, ASD: P=0.023), Platero et al. [ 8 ] (VOE: P=0.003, RVD: P=0.008, ASD: P=0.012), and Dawant et al. [ 9 ] (VOE: P=0.001, RVD: P=0.005, ASD: P=0.009). The consistency of our approach was further supported by low standard deviations (VOE: 0.8%, RVD: 0.5%, ASD: 0.3 mm) across all test cases.
Discussion
The integration of wavelet coefficients into the level set framework has been proven to be an effective approach for liver segmentation in CT images. The proposed method addresses two major challenges in liver segmentation: intensity inhomogeneity and textural complexity. By replacing conventional Gaussian kernels with wavelet-derived energy distributions, our method dynamically adapts to local texture variations and significantly reduces dependency on prior anatomical models. Our wavelet-level set fusion outperforms Gaussian-based level sets [ 2 ] in heterogeneous regions (Figure 2), as wavelet kernels more effectively capture local texture variations. For instance, in cases with tumors, the proposed method reduced boundary leakage by 12% compared to [ 2 ].
Performance Analysis
The proposed algorithm achieves a Volumetric Overlap Error (VOE) of 8.9%, demonstrating superior performance compared to existing approaches (Oliveira et al. [ 7 ]: 9.1%; Platero et al. [ 8 ]: 10.8%). This improvement primarily stems from our novel wavelet-adaptive level set framework, which effectively addresses two key limitations observed in prior work. Firstly, the Daubechies wavelet kernel (Section Qualitative Results) dynamically adjusts to local texture variations, proving particularly effective in heterogeneous regions and irregular morphologies, such as achieving 32% lower boundary ambiguity in post-surgical cases. Secondly, the fully automated initialization process (Section Quantitative Results) ensures precise segmentation while completely eliminating the requirement for manual intervention. These technical advances collectively enable the method’s 1.5 mm ASD accuracy, balancing clinical precision with workflow efficiency as detailed in Sections Advantages of the Proposed Method and Limitations and Future Work.
Compared to Dawant et al. [ 9 ], who reported a lower ASD (1.1 mm), our fully automated approach eliminates the need for semi-automatic corrections, striking a balance between precision and scalability. This capability renders the method ideal for clinical environments where high-throughput screenings are essential.
Advantages of the Proposed Method
The proposed method offers several advantages crucial for clinical application. Firstly, its texture-driven adaptation, achieved by incorporating wavelet energy skewness, autonomously adjusts to local intensity variations, thereby eliminating the need for manual parameter tuning. Secondly, the minimal user intervention required, needing only the initial slice selection, ensures user-friendliness and practicality for routine diagnostic workflows. Finally, its superior performance is confirmed through quantitative validation on the SLIVER07 dataset, demonstrating competitive metrics (VOE: 8.9%, ASD: 1.5 mm) that surpass existing level set variants.
Limitations and Future Work
While the proposed method demonstrates significant improvements, it is not without limitations. The computational complexity introduced by wavelet decomposition and skewness calculations increases runtime compared to traditional level set implementations. Additionally, the algorithm’s performance is contingent on the quality of the initial slice; poor contrast or artifacts in this slice may propagate errors to adjacent slices.
Future research will focus on three main areas. Firstly, efforts will concentrate on optimizing computational efficiency through methods like parallelized wavelet transforms and GPU acceleration to significantly reduce runtime. Secondly, the framework will be extended to multi-modal imaging, such as applying the method to MRI or PET-CT fusion to enhance clinical applicability. Finally, extensive validation on pathological cases, including further testing on datasets with tumors, cirrhosis, and other anomalies, is essential to improve robustness in diverse clinical scenarios.
Conclusion
The proposed method achieved a VOE of 8.9% and ASD of 1.5 mm on the SLIVER07 dataset, demonstrating superior accuracy over existing level set variants. Key innovations include texture-driven adaptation via wavelet energy skewness and fully automated initialization.
The method demonstrates three main strengths. Its texture-driven adaptation autonomously adjusts to local intensity variations, which effectively eliminates manual parameter tuning. This also ensures high clinical relevance through a fully automated workflow that minimizes user intervention. Finally, its superior performance is confirmed by quantitative validation on the SLIVER07 dataset, achieving competitive metrics (VOE: 8.9%, ASD: 1.5 mm) that surpass existing level set variants.
The proposed method effectively addresses challenges such as intensity inhomogeneity and textural complexity, making it a robust tool for liver segmentation in clinical settings. However, further research is needed to optimize computational efficiency and extend the framework to multi-modal imaging (e.g., MRI/PET fusion). Additionally, validation on datasets with pathological anomalies (e.g., tumors, cirrhosis) will ensure the method’s robustness across diverse clinical scenarios.
Acknowledgment
The authors gratefully acknowledge the support from Shahid Chamran University of Ahvaz.
Authors’ Contribution
Z. Firouzian conceptualized the study, wrote the initial draft, and prepared the manuscript. SE. Alavi supervised the research, reviewed the manuscript, and contributed to the final version. Gh. Akbarizadeh performed critical revisions, edited the manuscript, and validated the methodology. All authors read and approved the final manuscript.
Funding
This work was supported by Shahid Chamran University of Ahvaz [Grant Number SCU.EC1401.450].
Conflict of Interest
None
References
- Luo S, Li X, Li J. Review on the methods of automatic liver segmentation from abdominal images. J Comput Commun. 2014; 2(2):1-7. DOI
- Li C, Huang R, Ding Z, Gatenby JC, Metaxas DN, Gore JC. A level set method for image segmentation in the presence of intensity inhomogeneities with application to MRI. IEEE Trans Image Process. 2011; 20(7):2007-16. Publisher Full Text | DOI | PubMed [ PMC Free Article ]
- Okada T, Shimada R, Hori M, Nakamoto M, Chen YW, Nakamura H, Sato Y. Automated segmentation of the liver from 3D CT images using probabilistic atlas and multilevel statistical shape model. Acad Radiol. 2008; 15(11):1390-403. DOI | PubMed
- Chen YW, Tsubokawa K, Foruzan AH. Liver segmentation from low contrast open MR scans using K-means clustering and graph-cuts. In International Symposium on Neural Networks; Berlin, Heidelberg: Springer; 2010.
- Zhao Y, Zan Y, Wang X, Li G. Fuzzy C-means clustering-based multilayer perceptron neural network for liver CT images automatic segmentation. In Chinese control and decision conference; Xuzhou: IEEE; 2010.
- Foruzan AH, Chen YW, Zoroofi RA, Furukawa A, Sato Y, Hori M, Tomiyama N. Segmentation of liver in low-contrast images using K-means clustering and geodesic active contour algorithms. IEICE Trans Inf Syst. 2013; 96(4):798-807.
- Oliveira DA, Feitosa RQ, Correia MM. Liver segmentation using level sets and genetic algorithms. In International Conference on Computer Vision Theory and Applications In: VISAPP; Springer; 2009.
- Platero C, Tobar MC, Sanguino J, Poncela JM, Velasco O. Level set segmentation with shape and appearance models using affine moment descriptors. In Iberian Conference on Pattern Recognition and Image Analysis; Berlin, Heidelberg: Springer; 2011.
- Dawant BM, Li R, Lennon B, Li S. Semi-automatic segmentation of the liver and its evaluation on the MICCAI 2007 grand challenge data set. In: 3D Segmentation in the Clinic: A Grand Challenge; 2007.


